Cambridge Systematics Launches LOCUS, a SaaS and Big Data Solutions Subsidiary
Learn how the new company will be providing innovative transportation solutions through advanced analytics and data integration.
In the early hours of March 26, 2024, the unexpected collapse of the Francis Scott Key Bridge in Baltimore disrupted daily commutes and presented significant challenges to traffic management and the broader transportation ecosystem.
This instance underscores the critical role of real-time traffic data in responding to and managing the impact of unforeseen events on traffic flow and urban mobility. By leveraging rich GPS-based traffic data, authorities and planners can swiftly analyze the impacts of such incidents, understanding not only the shift in traffic patterns but also the broader implications on mobility and the supply chain.
When the Francis Scott Key Bridge was struck by cargo ship Dali, it highlighted the complexities of urban traffic dynamics under stress. Following the collapse, there was a notable shift in traffic patterns, with an observed decrease in trips to the Eastern sides of Baltimore, specifically Sparrows Point and nearby areas.
.jpg)
Operations in the port of Baltimore were suspended following a collision between the ship Dali and the Francis Scott Key Bridge
Data analytics can provide a lens through which the city can observe and assess the spread of congestion to adjacent routes, enabling targeted interventions to alleviate pressure on critical junctions and maintain mobility in the face of unprecedented circumstances. Let’s take a closer look at trip patterns to key destinations before and after the collapse of the bridge.
We examined trip origins before and after the Francis Scott Key Bridge collapse, finding consistent locations: Baltimore City, Harford County, Cecil County, Pennsylvania, and New Jersey to the North/Northwest, and Anne Arundel County, Prince George's County, Howard County, and Virginia to the South/Southwest. While trip lengths and durations from the North to the East sides of Baltimore showed little change, those from the South increased by 3 to 8 miles and 10 to 20 minutes due to heavy traffic previously routed via the FSK bridge.
Commercial vehicles constitute the majority of trips to the impacted area at 70% of total trips, of which 50% are heavy-duty trucks. The bridge acts as a critical artery to distribution centers, notably including Amazon and BMW, and commercial areas in Eastern Baltimore.
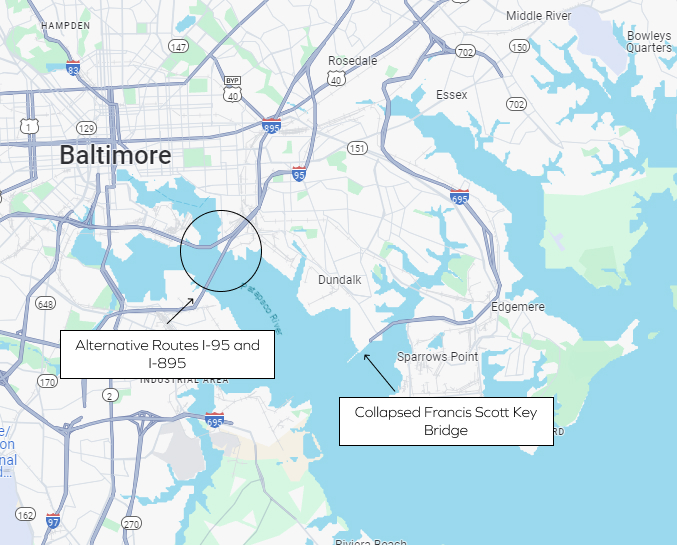
Alternative Routes I-95 and I-895
The chart below shows trips taking place on the 19th and 26th of March, comparing traffic flows from Southern and South-Western parts of Baltimore before and after the incident. Over 95% of trips from Southern and South-Western Baltimore normally utilize the bridge to reach Eastern Baltimore. For comparison, only 2.5% of trips destined to distribution centers and other commercial areas utilized Routes I-95 and I-895 before the incident.
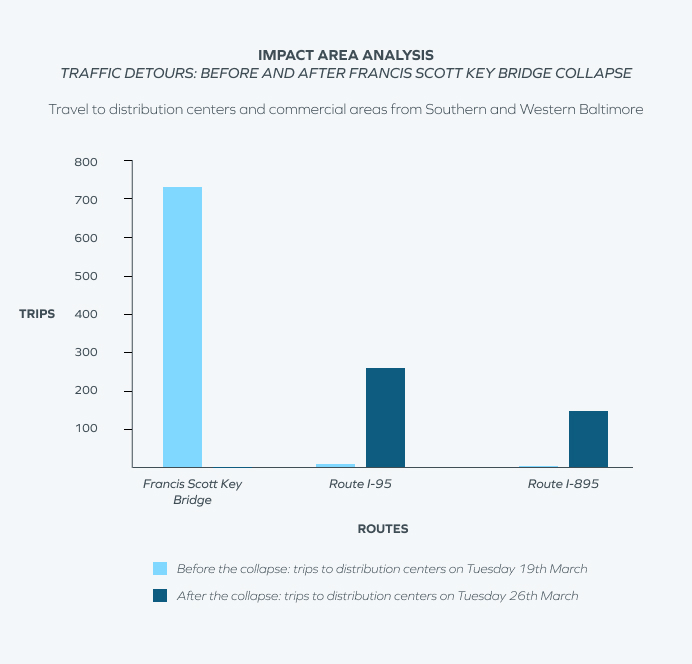
Impact Area Analysis: Before and after the Francis Scott Key Bridge Collapse
On the 26th of March, 57% of trips from Southern and Western Baltimore destined to the distribution centers in Eastern Baltimore utilized the I-95, and 32% took the I-895 as alternative pathways. A similar trend can be observed in the week following the collapse: 55% of trips took the I-95 and 36% took the I-895 as alternative routes. The collapse of the bridge resulted in an overall reduction in trips across the affected routes, with the diversion of cargo to nearby ports resulting in a decreased travel to Baltimore distribution centers.
Data analysis also allows for a close examination of trips from particular areas of Baltimore that would typically use the collapsed bridge to travel. Trips from the Southern parts of Baltimore to the impacted area, for instance, decreased by between 24% and 35%. The overall trip duration from southern parts of the impact zone increased by 10-20 minutes, and trip lengths increased by 3-8 miles as a result of necessary trip detours.
More targeted route analysis for trips bound to the impacted zone shows that before the incident, the FSK Bridge was the most used route from Anne Arundel County to the impacted commercial areas and distribution centers. After the incident, the I-95 and I-895 were used as alternative routes. These particular detours caused the trip duration to increase from about 6 minutes to 18 minutes, and the trip length to increase from 5 miles to 13 miles.
Other alternative paths for trips from Virginia to the impacted zone include a route around Baltimore city using the Baltimore Beltway, which also increased trip durations from 72 minutes to 88 minutes due to the length of the detours.
The data above is merely the tip of the iceberg of traffic insights that can be gleaned from such data. A temporary channel with restricted access to the Port of Baltimore has been made operational at the end of April, with a full reopening of the channel projected to occur by the end of May. This timeline may be subject to change due to weather conditions and the nature of the damage. The resulting scramble to divert cargo to neighboring ports has led to increased travel times, delays, costs, and carbon emissions, and has also placed additional stress on the trucking industry.
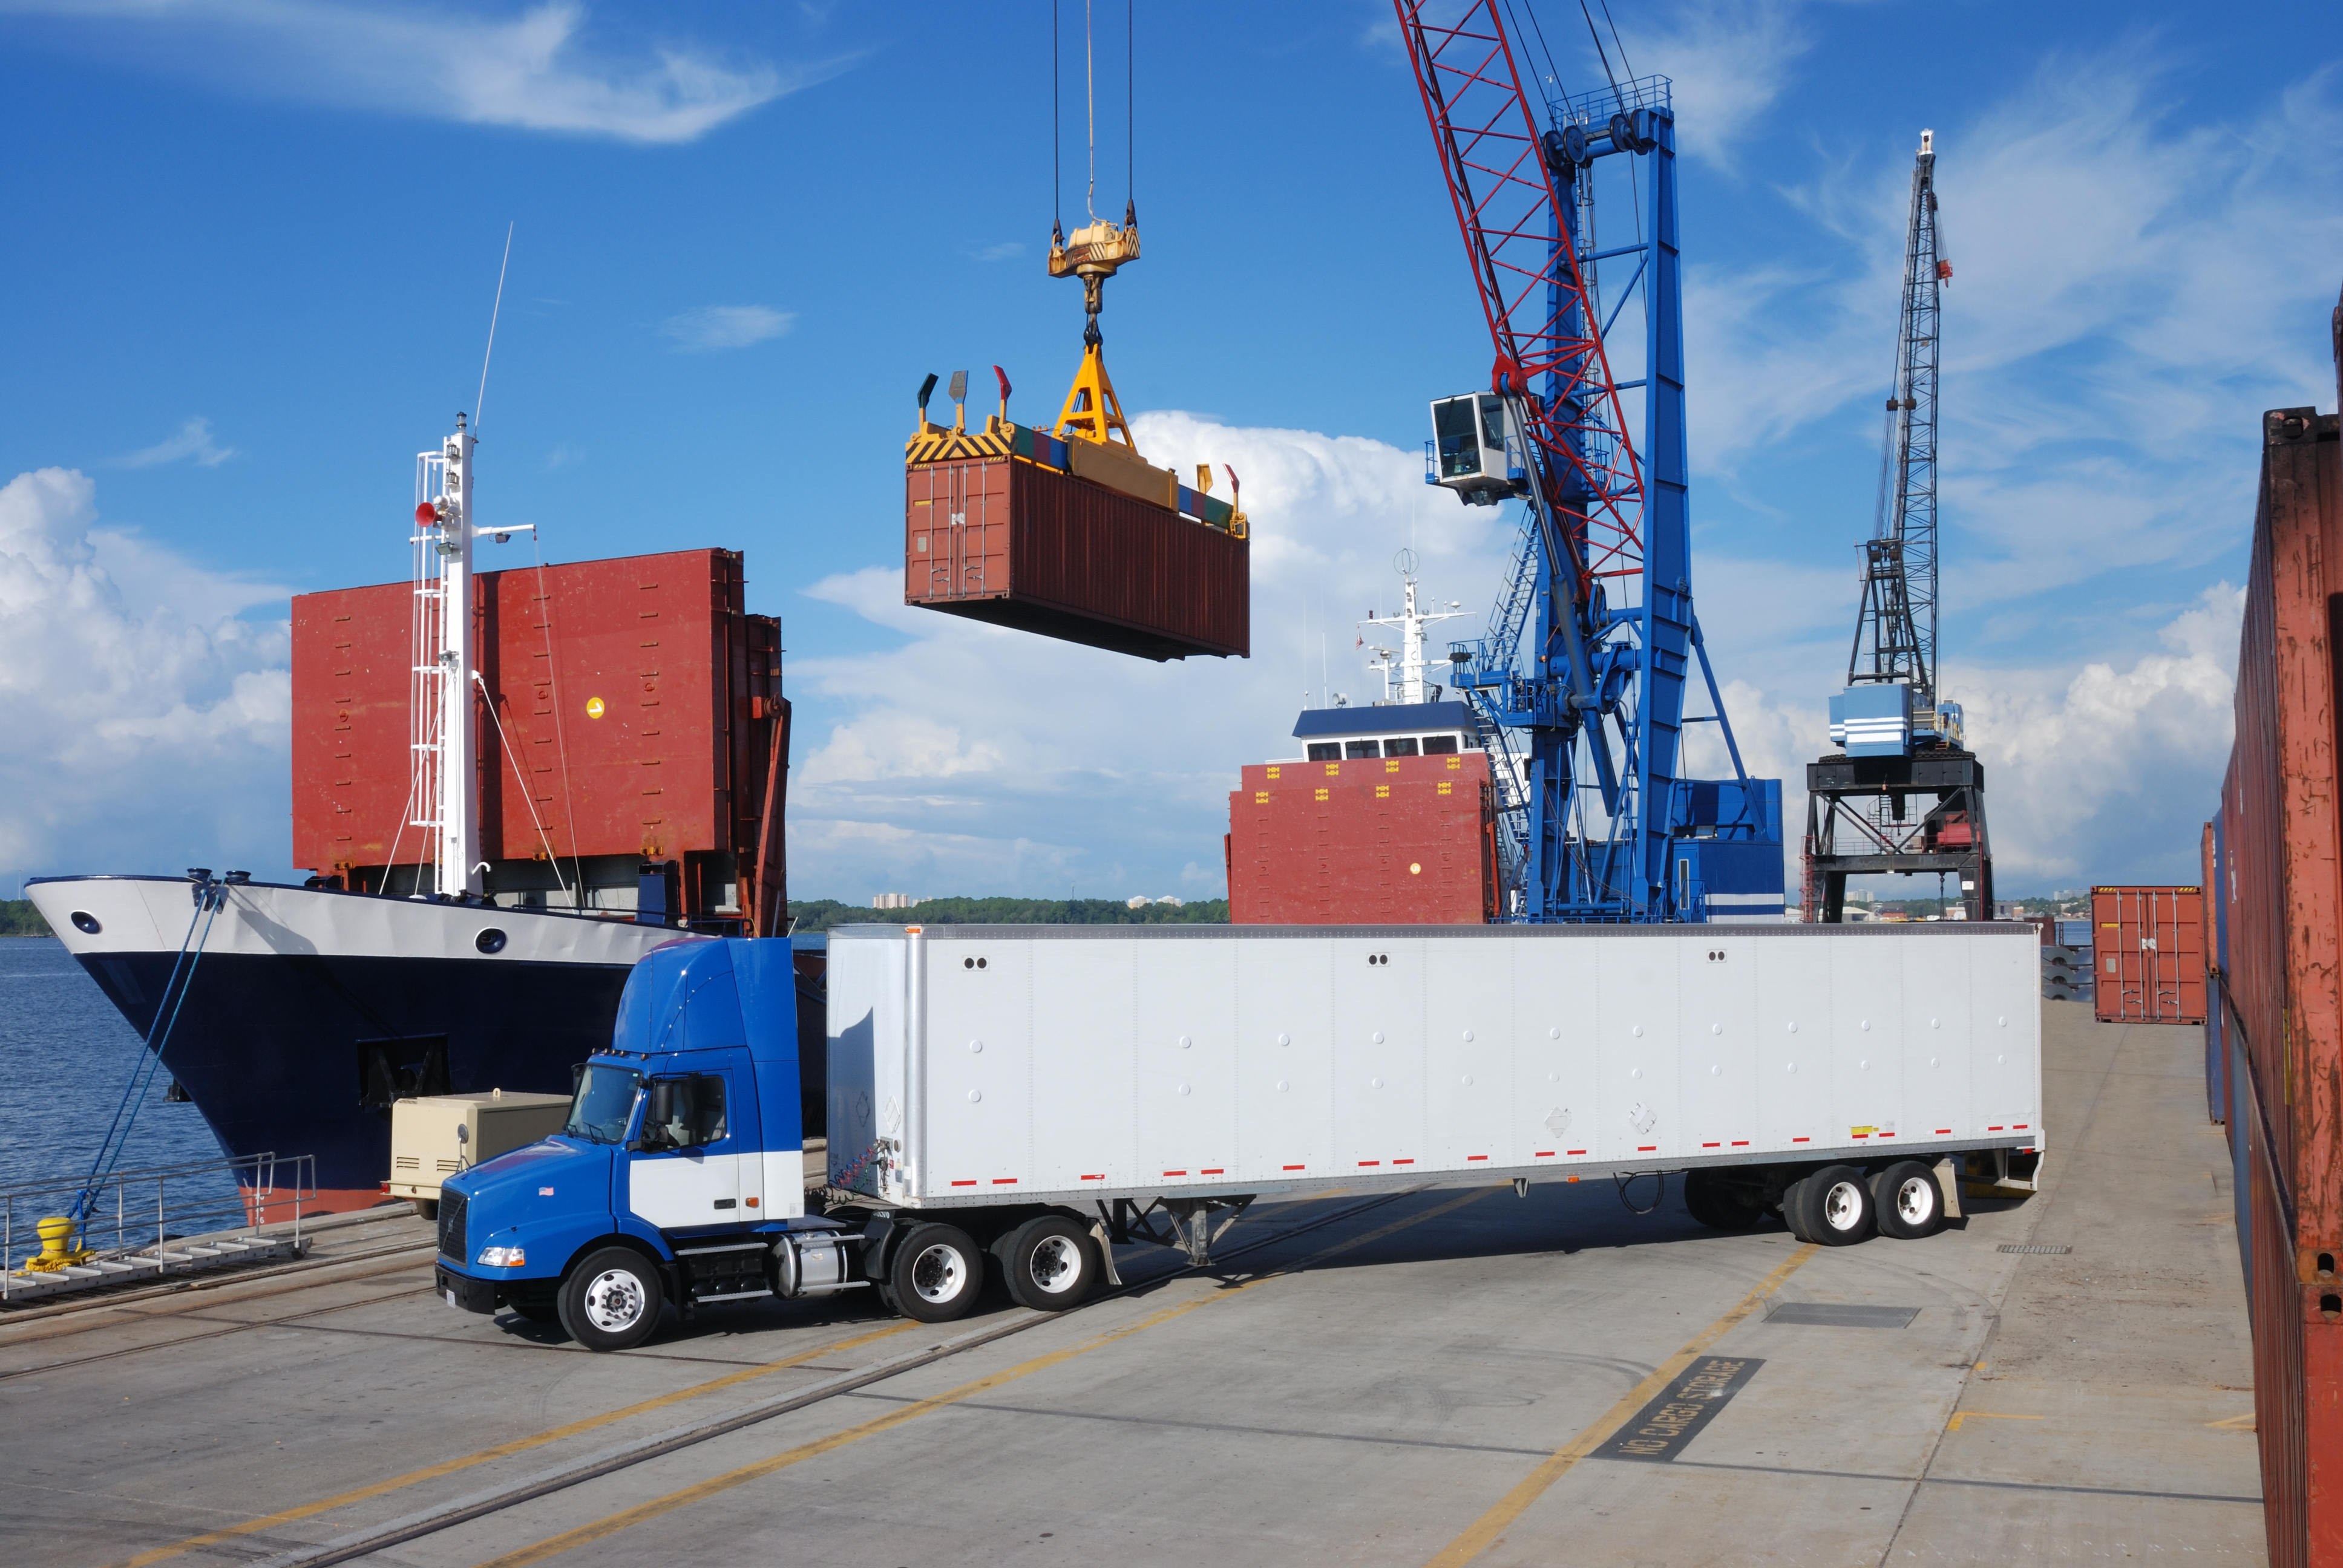
The collapse of this bridge has placed increasing stress on the trucking industry
To help understand and quantify the tangible implications of crises such as this, LOCUS harnesses anonymous GPS measurements collected from millions of devices to provide insight into traffic flows, congestion, and mobility dynamics. This offers not just a snapshot of the immediate impacts but a dynamic, evolving view of traffic patterns and behaviors.
City planners and traffic authorities can utilize detailed, actionable reports, customized to address the unique challenges posed by each event. Real-time insights can facilitate rapid decision-making, optimizing rerouting strategies to mitigate congestion and streamline the flow of goods and services.
The collapse of the Francis Scott Key Bridge serves as a poignant reminder of the vulnerabilities inherent in our transportation networks. It also highlights the transformative potential of traffic data analytics. By offering a detailed understanding of how such events affect mobility, this technology plays a crucial role in responding to crises and proactively shaping the future of transportation.
Learn how the new company will be providing innovative transportation solutions through advanced analytics and data integration.
Learn how the new company will be providing innovative transportation solutions through advanced analytics and data integration.
We created an alternate NFL championship playoff based on only transportation metrics.