Heavy Truck Travel Across the United States
Dive into LOCUS Truck's insights surrounding heavy truck flows across different states.
Recent wildfires in Los Angeles county had drastic impacts on the communities it affected – disrupting lives, upending travel patterns, damaging critical infrastructure, and putting pressure on transportation network.
Two of the biggest fires, Palisades and Eaton, fanned by hurricane-force Santa Ana winds, collectively burned over 37,000 acres and damaged over 18,000 structures. While the region is no stranger to wildfires, these fires burned through densely populated communities, many of which had little time to prepare or react. It took over 24 days to fully contain them.
In this article, we use LOCUS to put into perspective the scale of impact in two communities - Altadena and Pacific Palisades - by looking at travel patterns, immediate impacts on the transportation network in terms of speed, and recovery of travel. For Altadena, we also analyzed how truck activity changed in the neighborhood in the weeks following the fire.
First, we analyze the “steady state” size of the travel markets that were disrupted using LOCUS Person data – there are over 61,000 daily trips in Pacific Palisades and 70,000 daily trips in Altadena in 2024. Many of these trips are local trips made by residents of these communities.
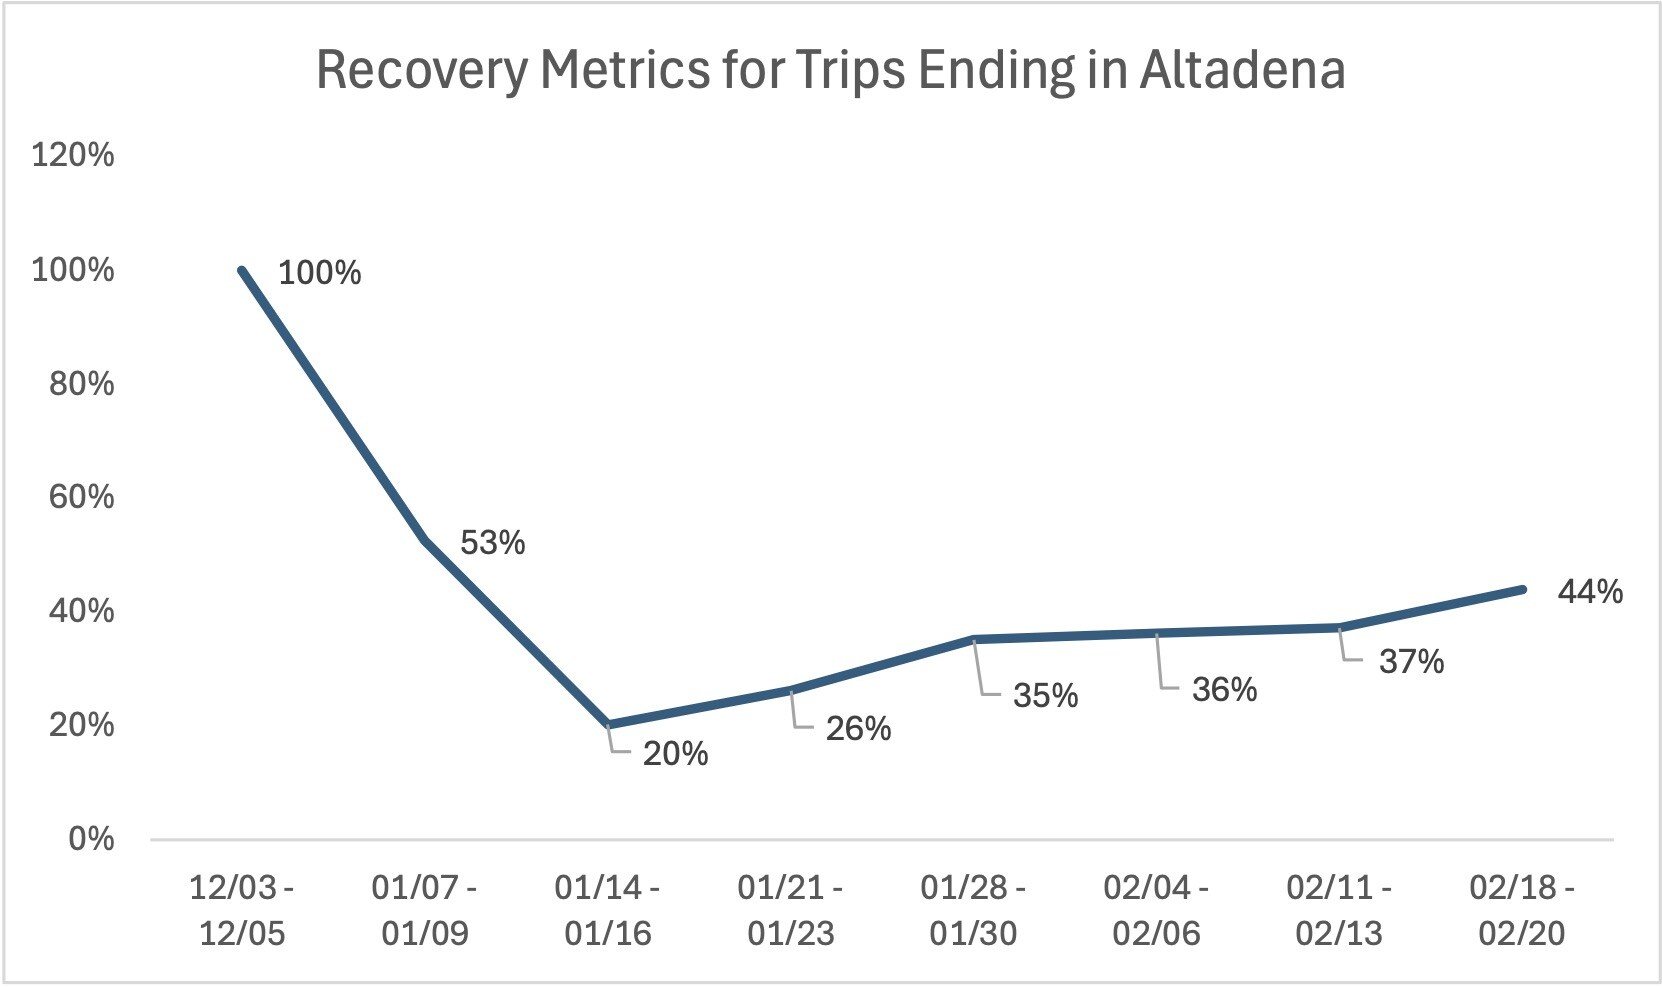
Next, we study impacts on the passenger vehicular trips observed in the communities in the weeks immediately following the fires, using connected vehicle data from TomTom. By benchmarking the observed trips against the pre-fire conditions, we can study how travel dropped during the days when the fires were most active (Jan 7-9 and Jan 14-16 periods) and how travel has recovered in the subsequent weeks.
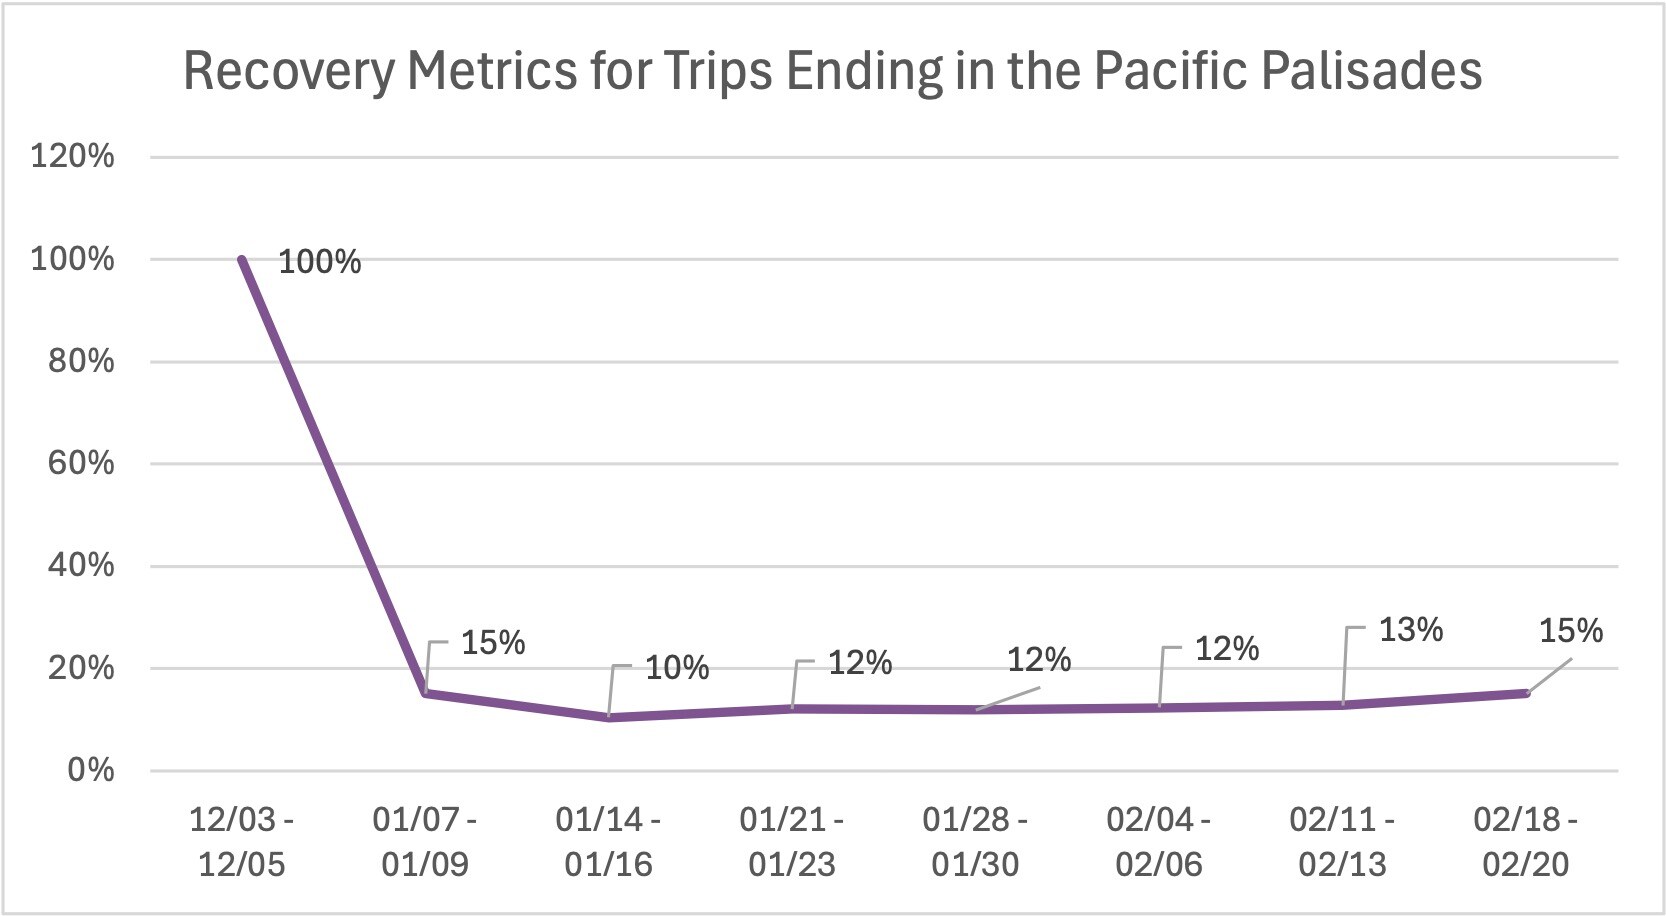
The sudden explosion in the size of the fire resulted in the issuing of multiple evacuation orders by local agencies. This contributed to an increase in the number of passenger and emergency response vehicles on the roads, putting stress on the transportation network.
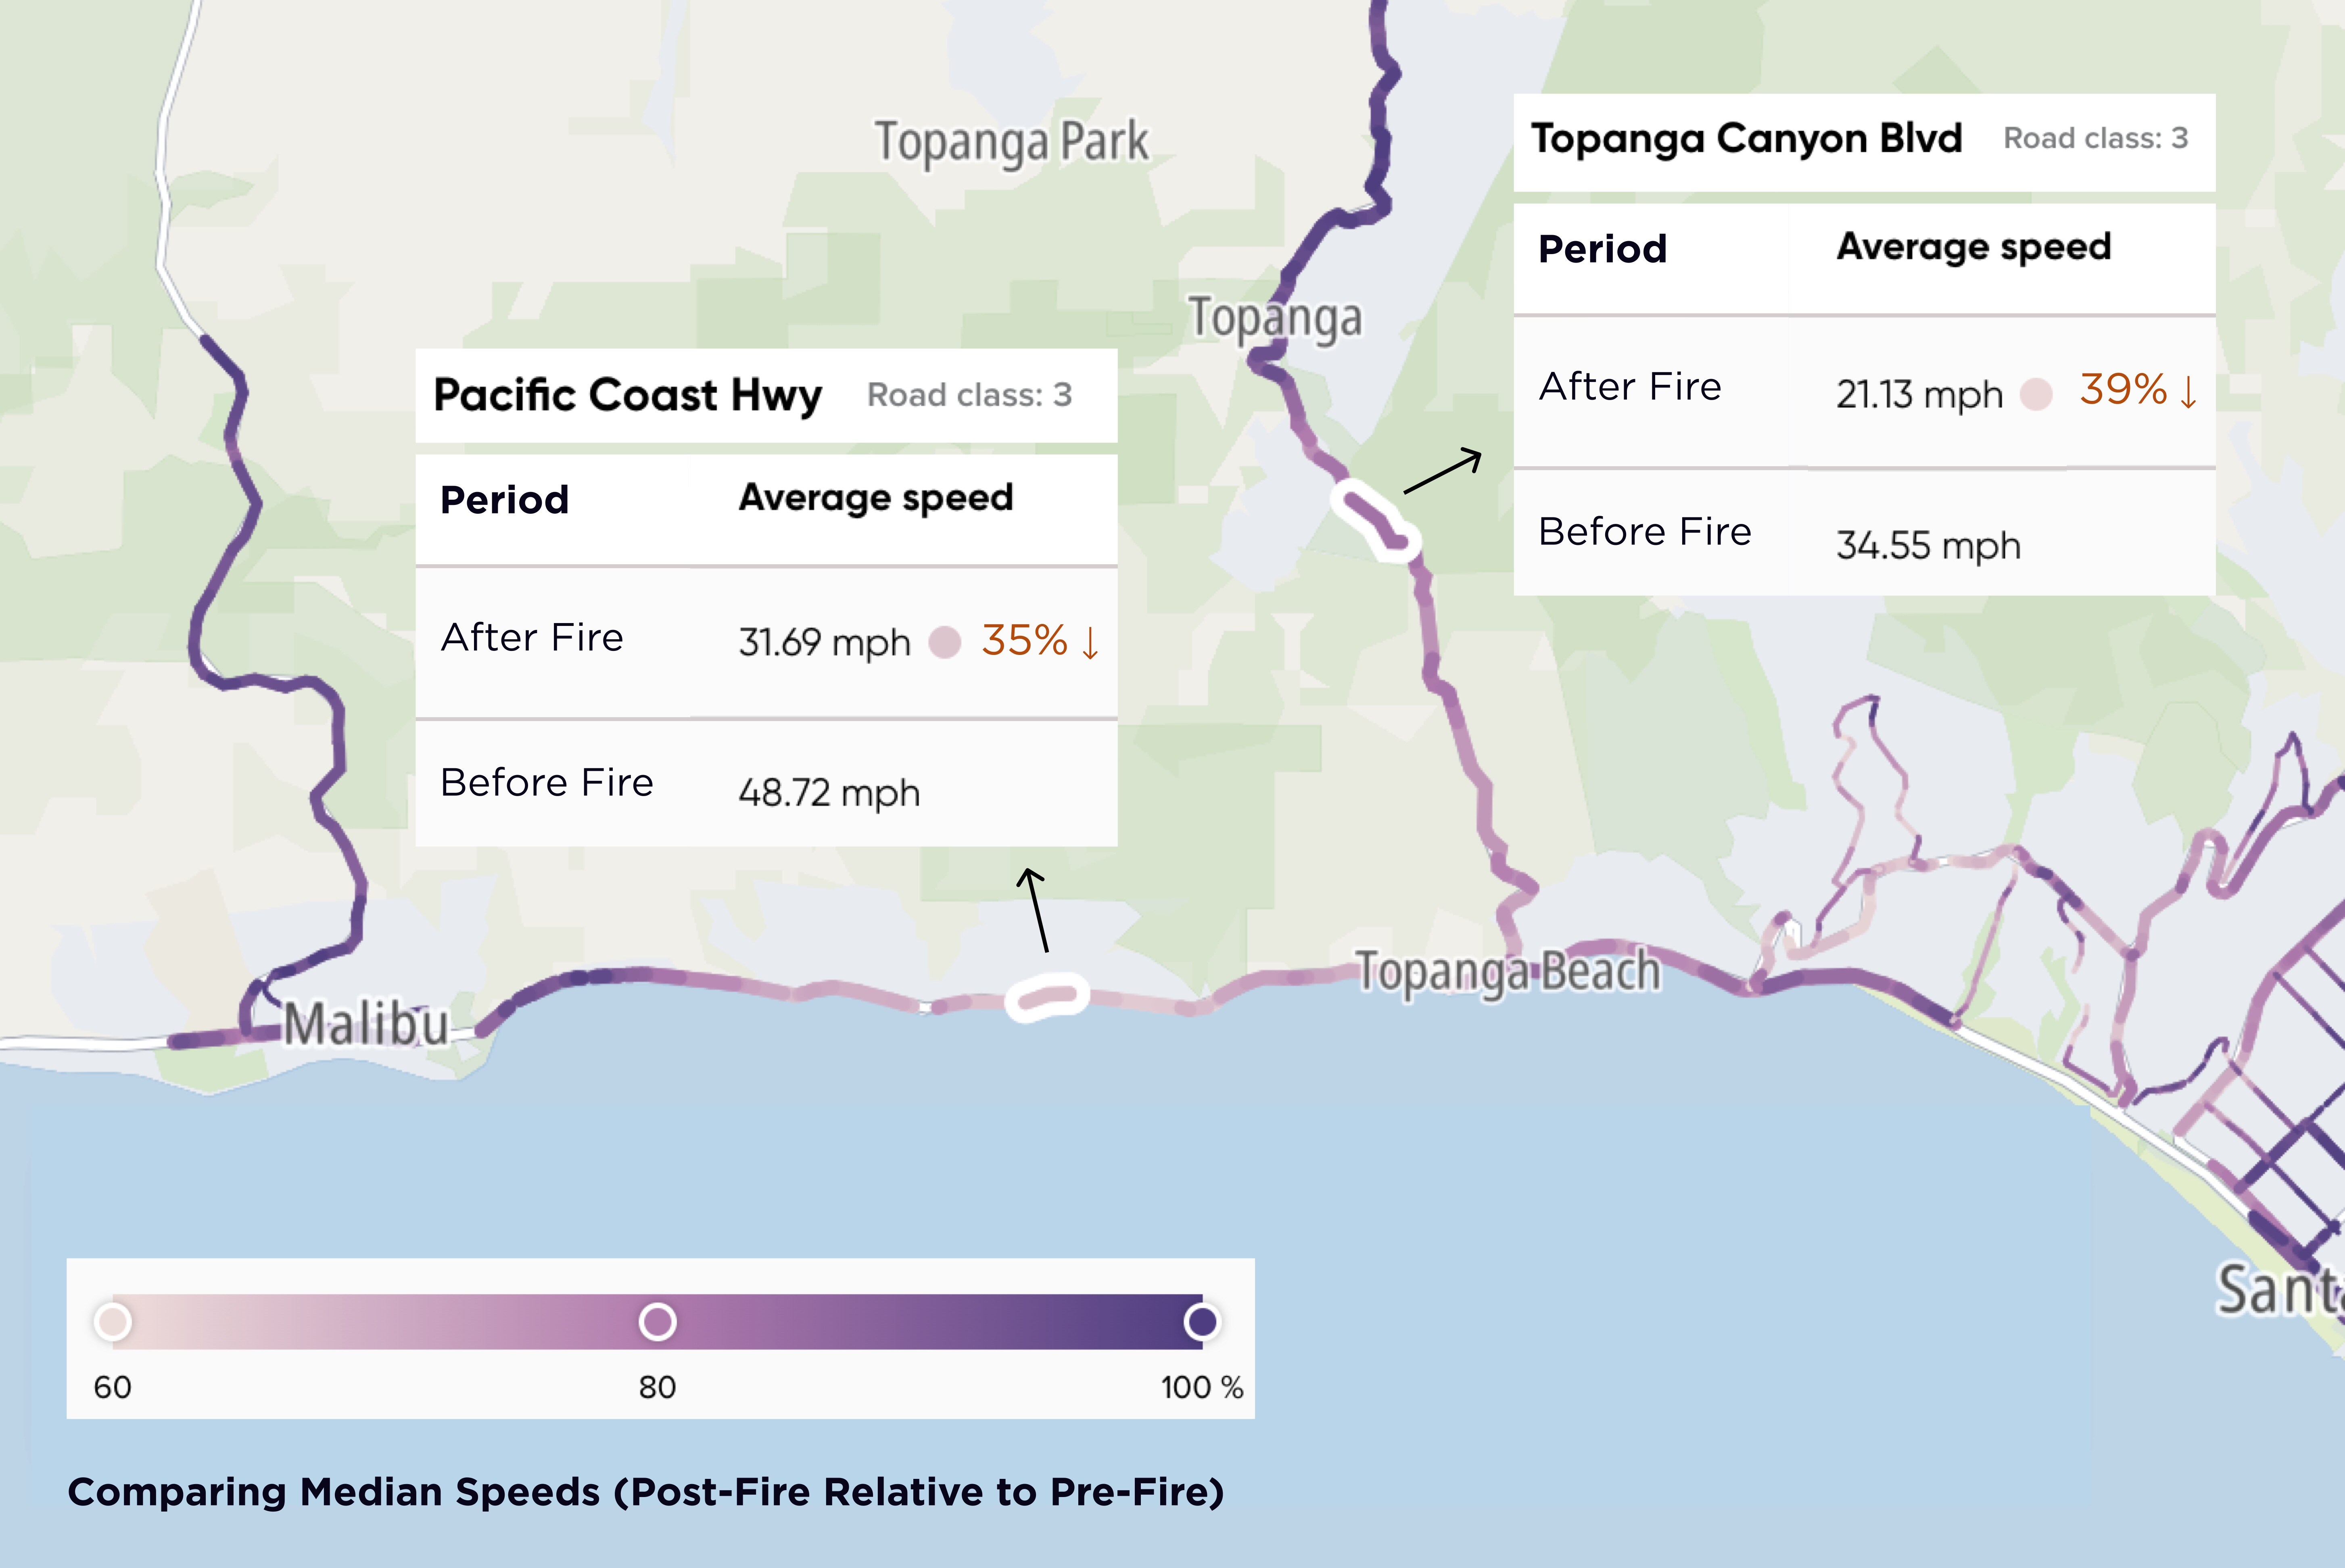
Unlike Altadena, the Palisades have a hilly terrain and fewer roads connecting the communities to freeways, leaving fewer evacuation route options for travelers. Two main roadways in the region saw a near 40% decrease in average travel speeds immediately after the fires. Some roadway links were worse off than others.
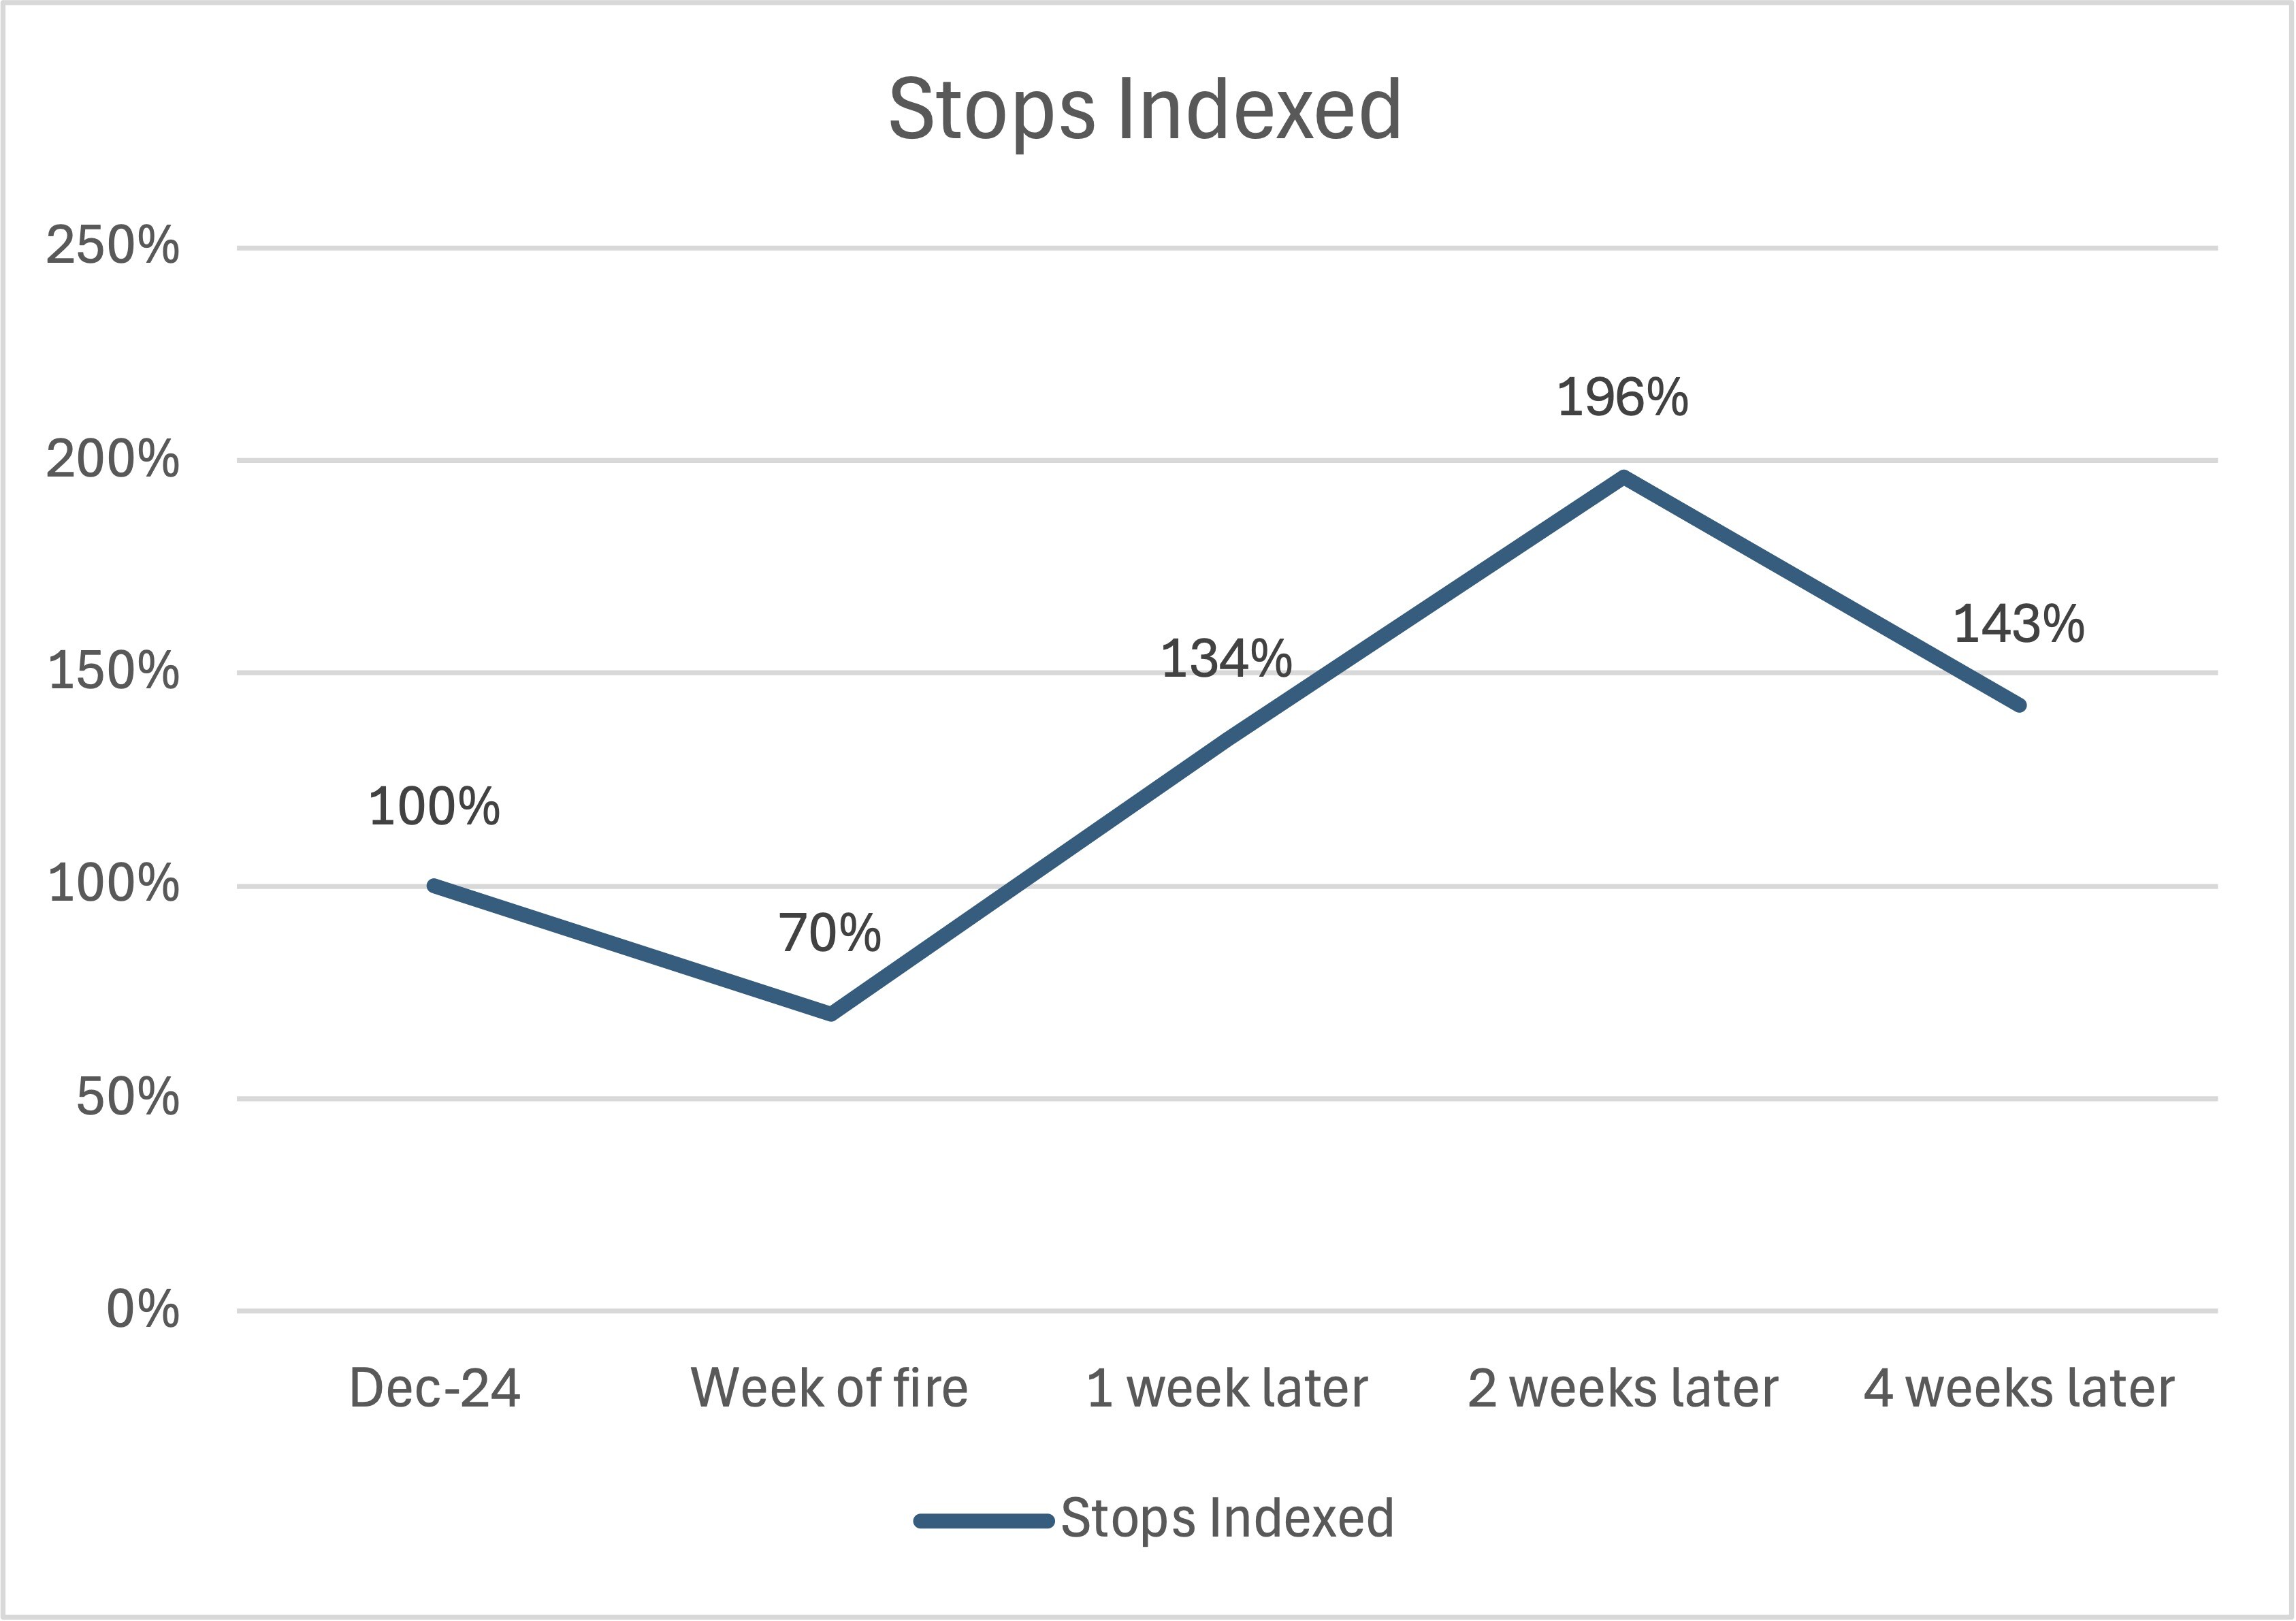
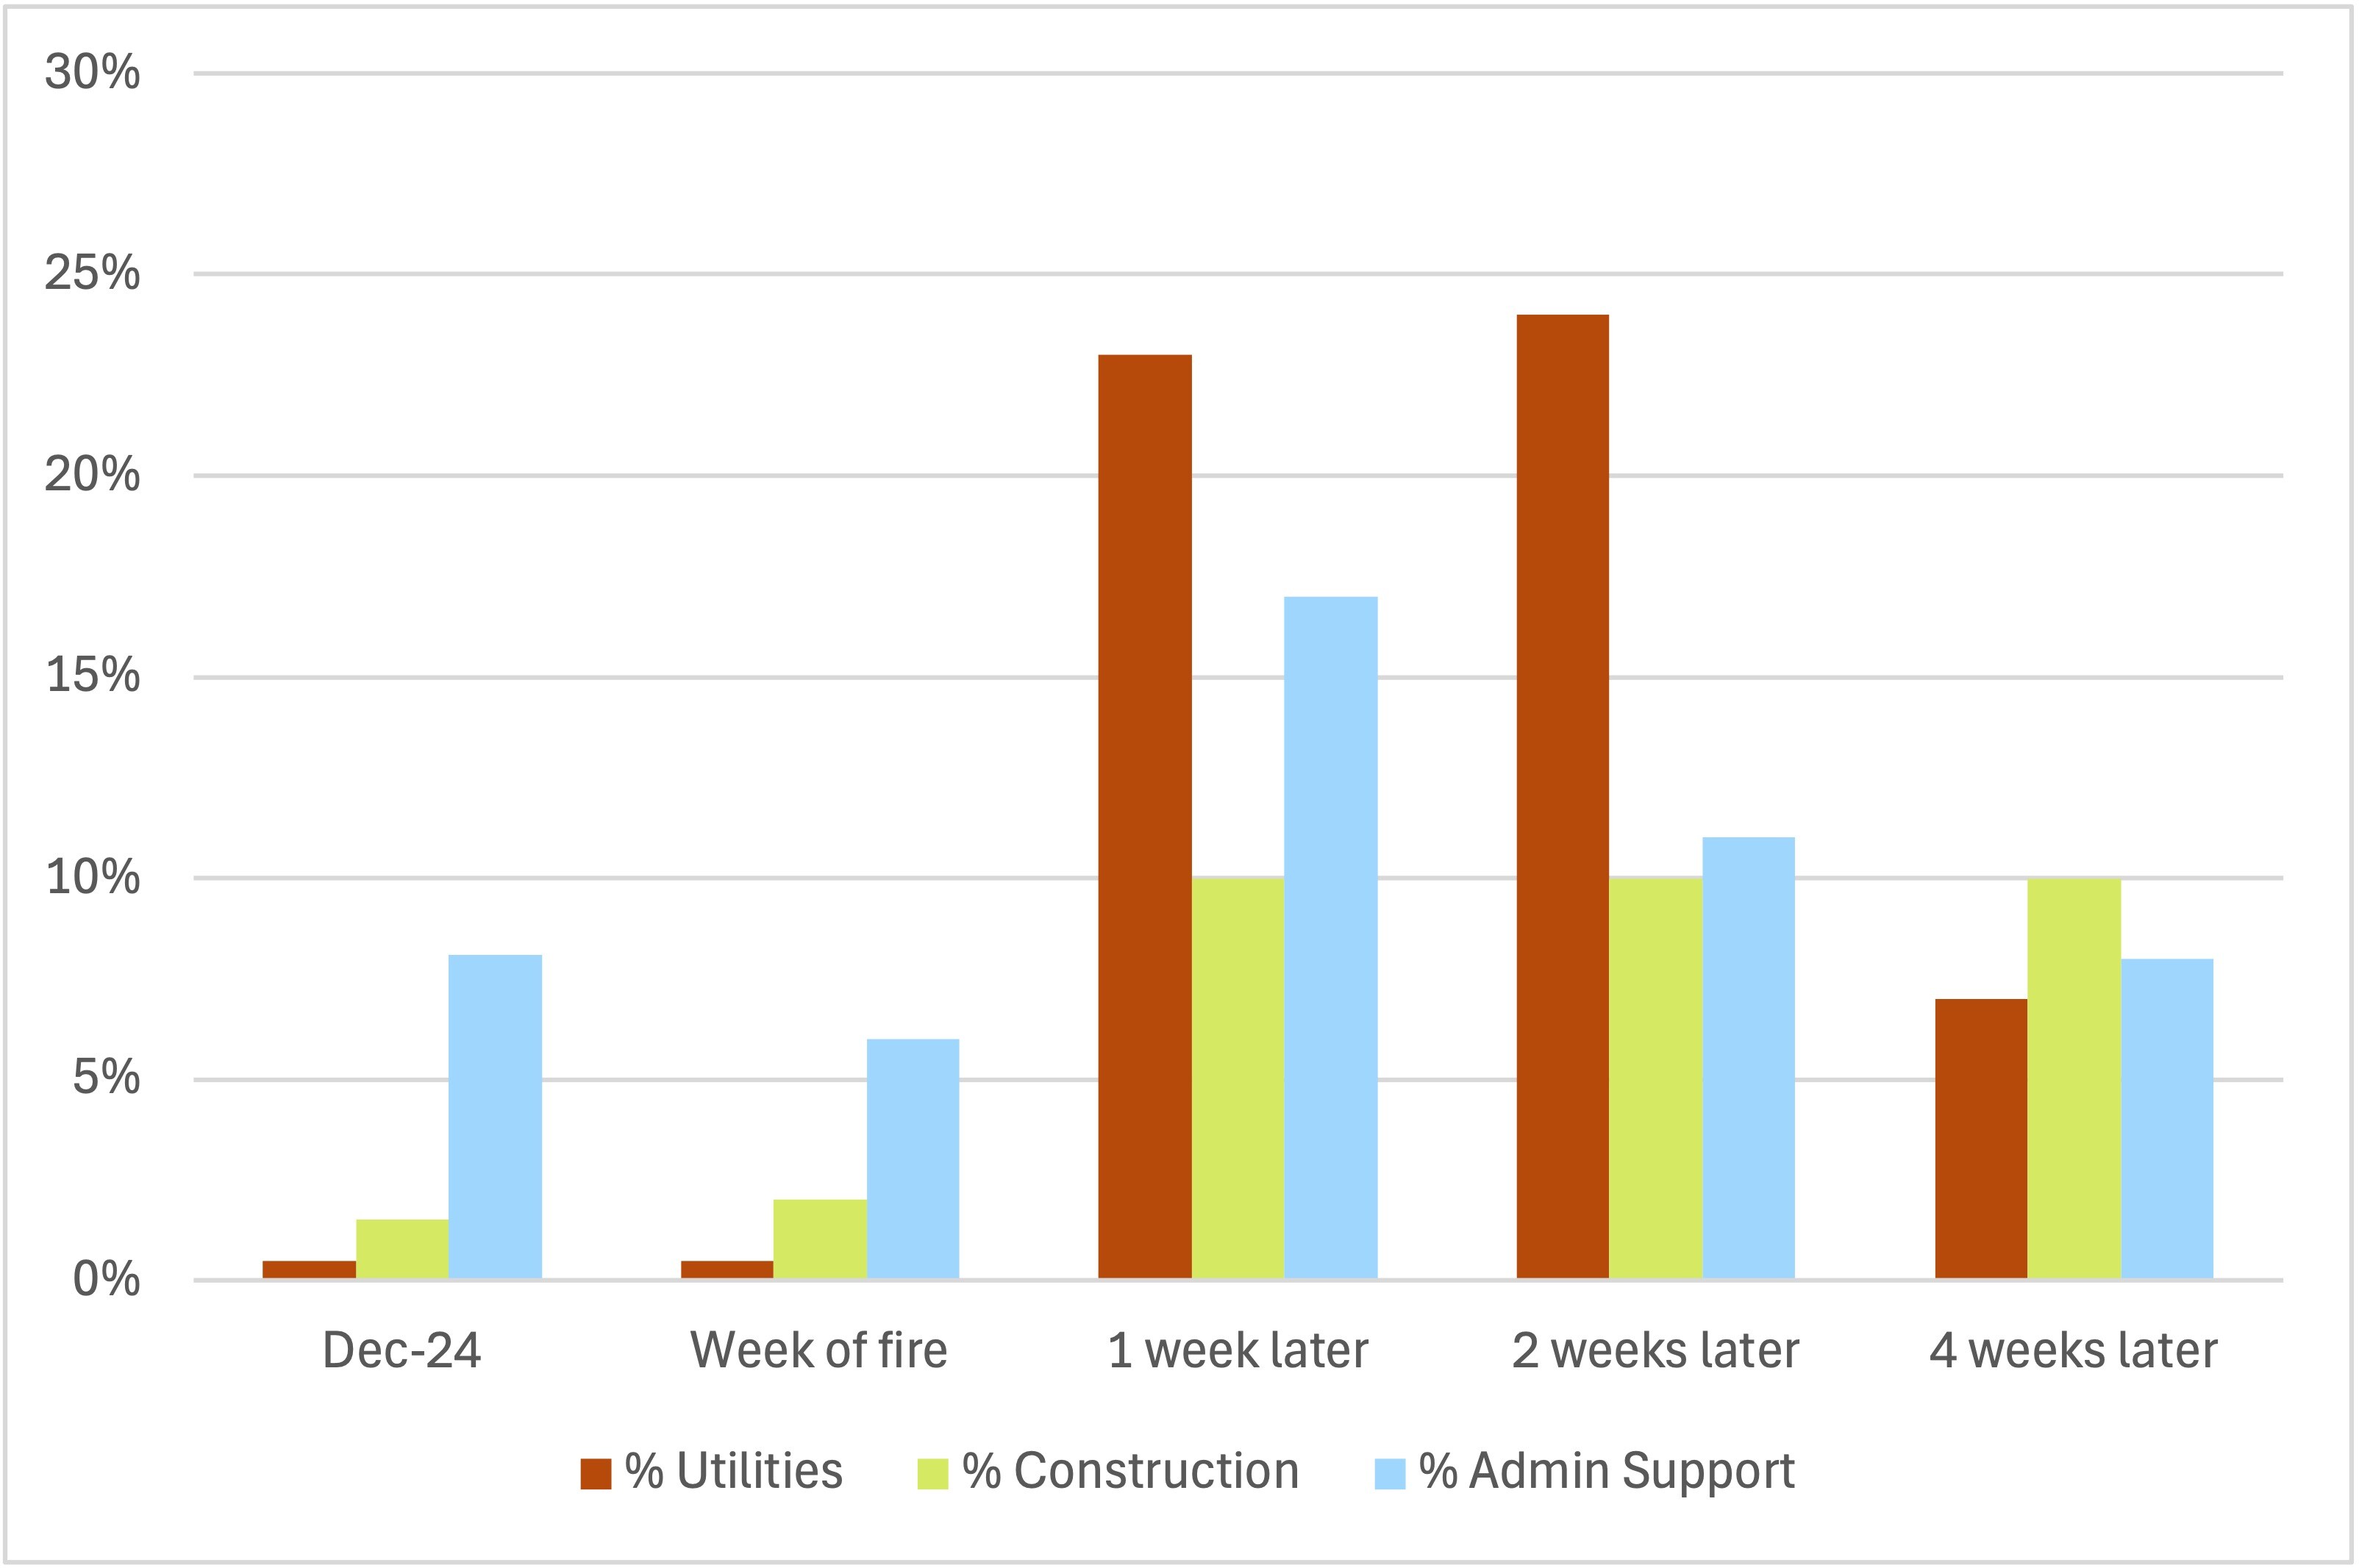
Using “operational data layers” in LOCUS Truck, we looked at how truck activity patterns changed in Altadena – particularly the number of daily truck stops, the mix of truck types, and industries they were associated with . As the residents evacuated, there was an influx of trucks in the community in the weeks following the fire.
The fires also required Metro to reroute or suspend several key bus lines, resulting in a need for transit-dependent riders to divert to longer and less reliable trips. Service along Metro Line 134, which travels through Sunset Boulevard, was entirely discontinued. Metro Line 602, which serves the Pacific Palisades, had to be modified to avoid damaged roadways. In Altadena, the Metro Micro Service – designed to provide first-mile and last-mile connectivity – was suspended, which also severed access to transit options.
With extreme weather events continuing to grow in number and intensity, building resilience from the bottom-up is critical. This means we need a very accurate understanding of communities and their travel patterns, the state of infrastructure, goods movements and supply chain, and risk profiles for the most vulnerable communities and infrastructure assets.
Insights from LOCUS can help agencies develop planning scenarios including evacuation, targeted recovery operations, and detour management. LOCUS can help with documenting travel information and community risk profiles, allowing agencies to make a strong case to secure the funding needed to improve resilience.
Dive into LOCUS Truck's insights surrounding heavy truck flows across different states.
Dive into LOCUS Truck's innovative insights into freight flows in Arizona.
The total solar eclipse in April 2024 drew record crowds, revealing intriguing traffic patterns around regions of totality.