Unpacking E-Commerce Truck Travel in LA Neighborhoods
Dive into LOCUS Truck's insights surrounding light-duty truck flows in Los Angeles.
The total solar eclipse on April 8th 2024 offered more than a novel celestial occurrence; the event also drew record crowds, revealing intriguing traffic patterns around regions of totality. In this piece, we study the congestion around major north-and-south-bound roads and highways in Northern Vermont, and examine the southbound I-87 corridor from Vermont to New York.
A staggering increase in trip volumes can be visualized on a statewide level by looking at a comparative snapshot of travel in Northern Vermont. Using connected vehicle data, we can analyze the significant increase in congestion. The image below shows the variation in observed trips on the day of the eclipse as compared to on a regular weekday. The darker the segment, the more pronounced the percent difference in the relative number of trips.
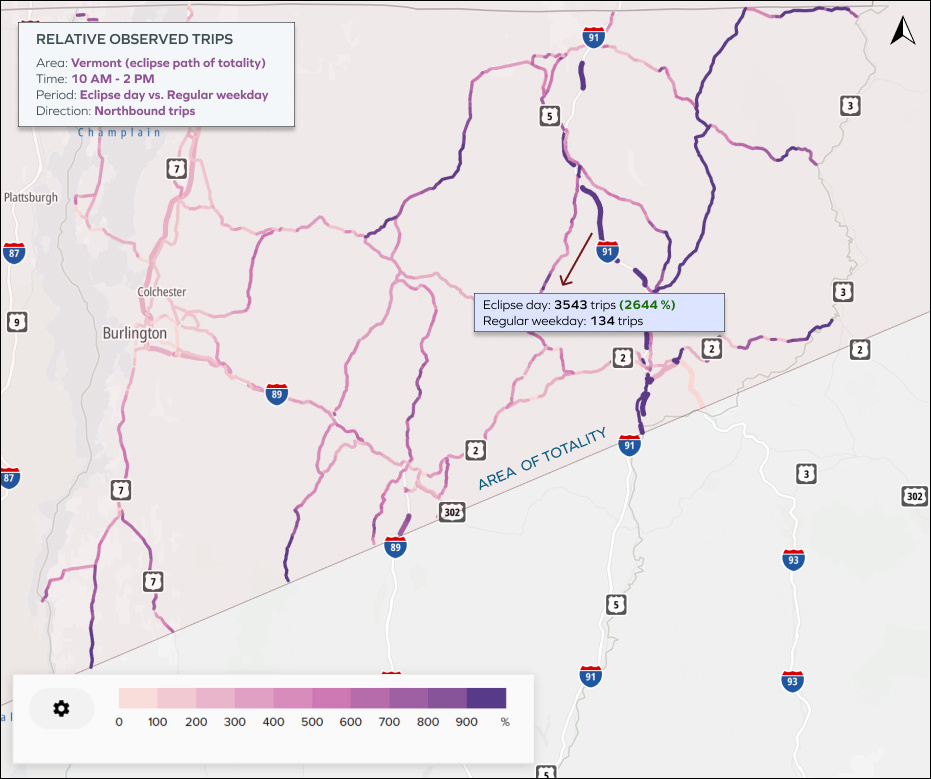
Relative volume of northbound trips traveling to areas of totality from 10 AM – 2 PM on the day of the eclipse as compared to a regular weekday
Speeds Plummet as Congestion Soars
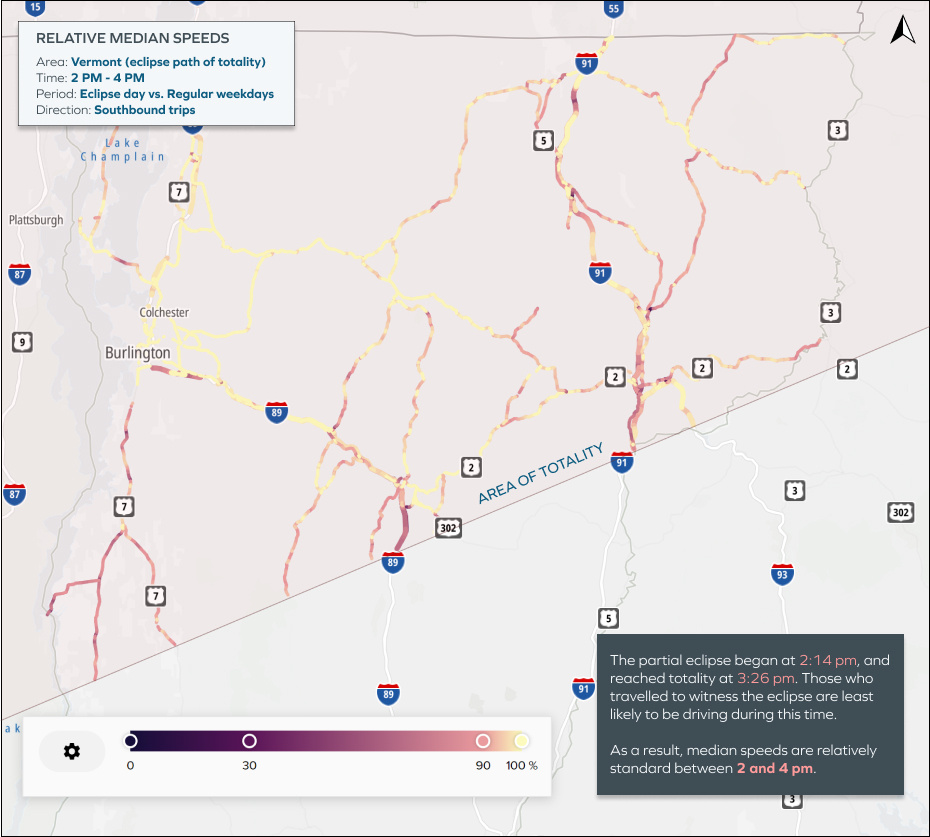
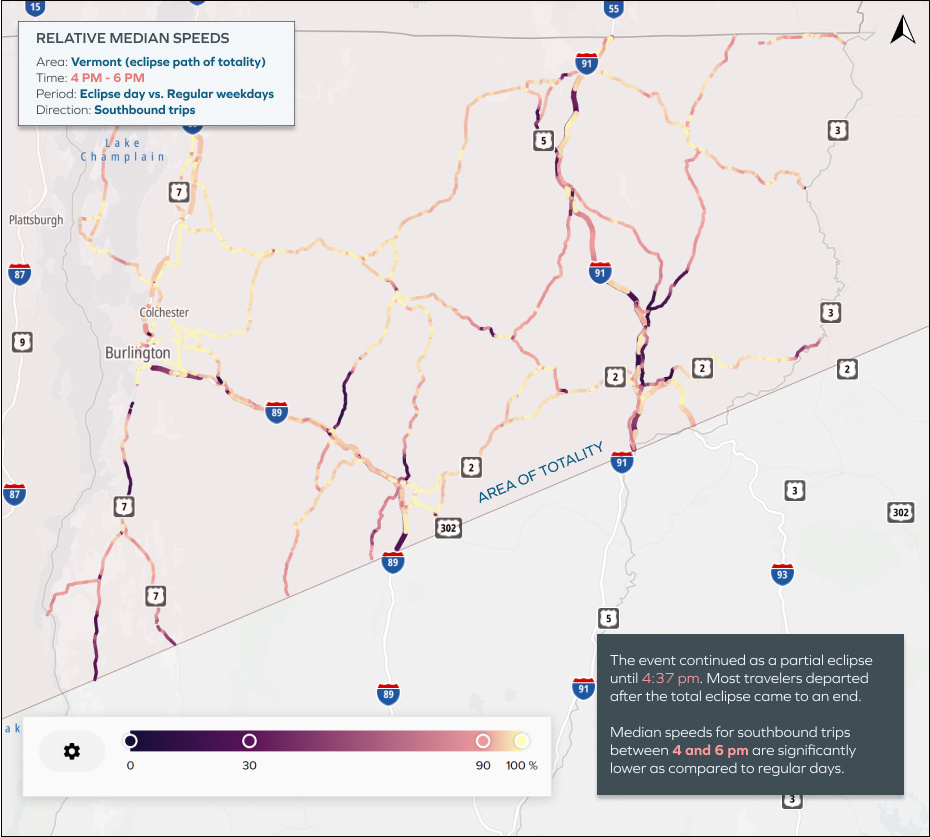
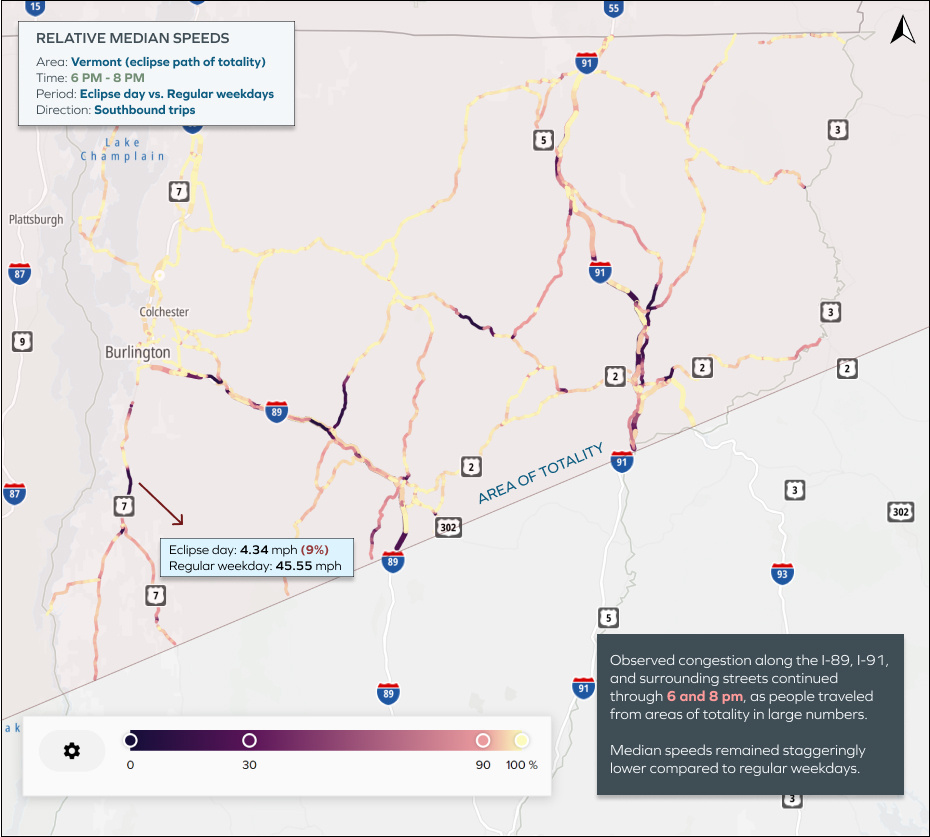
On the day of the eclipse, median speeds were dramatically reduced along corridors that led to areas of totality. By comparing median speeds of southbound trips after the eclipse relative to median speeds on regular weekdays, this significant difference in speeds can be observed.
A closer look at comparative median speeds is shown below. Darker segments on the map indicate that the median speeds of trips along the relevant route were proportionately much lower after the eclipse, when travelers were returning home, as compared to a regular weekday.
Scroll through the slides below for a relative snapshot of the congestion's progression.

These travel patterns can also be examined on a more granular level. Interstate 87 connects New York with Montreal, and was utilized heavily by those traveling between areas of totality in Vermont and parts of New York.
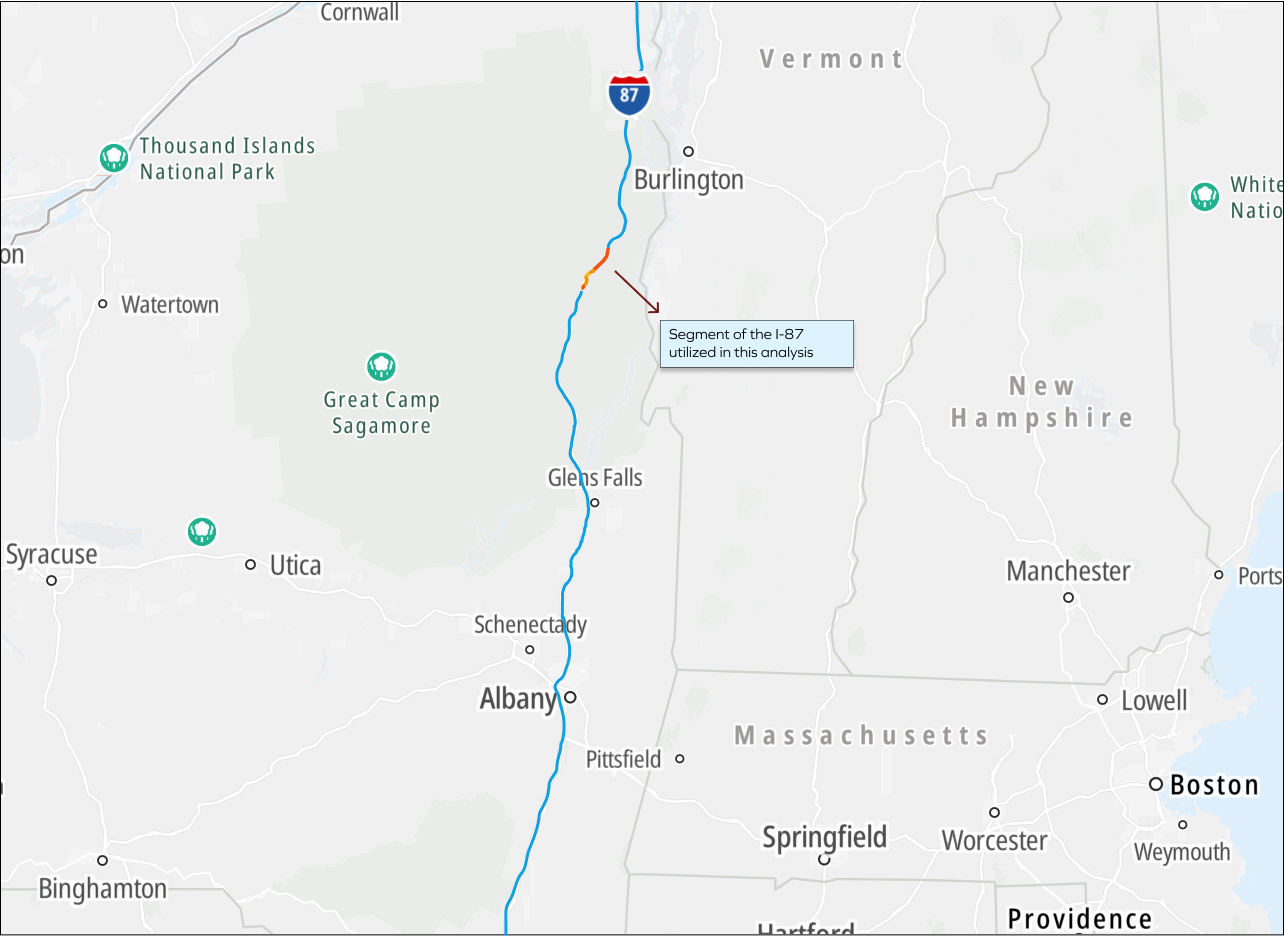
Southbound Interstate 87
On the Monday prior to the eclipse, under 250 trips were recorded along the I-87 corridor during 5 PM and 8 PM. However, on the day of the eclipse, this number skyrocketed to over 2200 trips. This is a staggering increase that underscores the eclipse's draw and its influence on travel patterns.
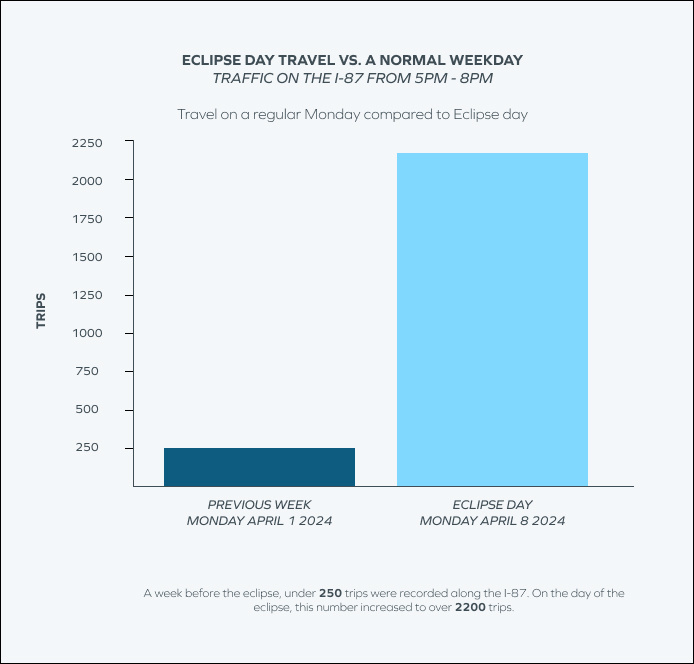
Number of trips observed on a regular weekday compared to eclipse day
Median speeds on the I-87 on the Monday prior were robust, averaging between 70 and 75 miles per hour. In stark contrast, speeds on eclipse day dropped significantly, averaging between 16 and 35 miles per hours. Speeds on eclipse day were at an average of 18 mph along this stretch of road, and were at an average of 73.5 mph on the Monday prior, demonstrating over a 75% decrease in speed on eclipse day. View these changes in median speed along this segment of the I-87 below.
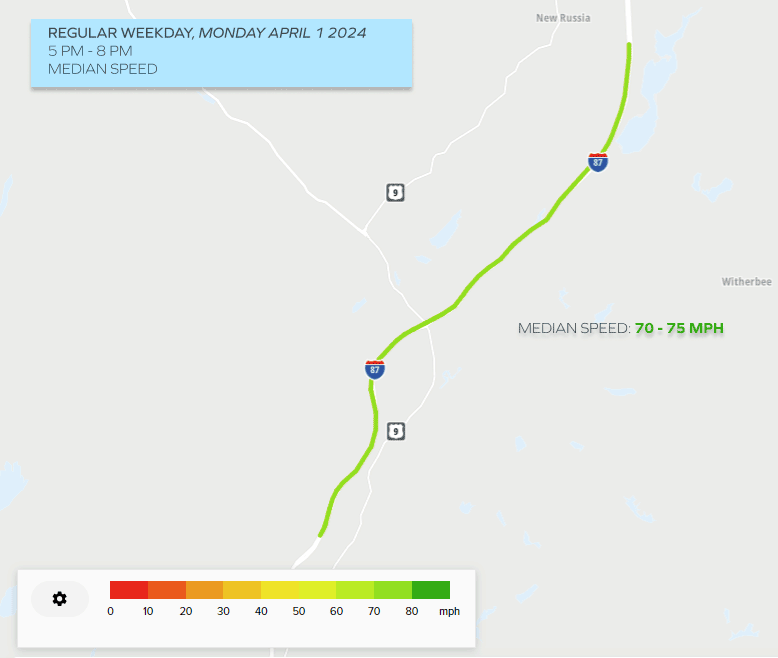
Median speeds on the I-87 on a regular weekday vs. eclipse day
Travel flows on the day of the eclipse provided a unique lens through which we can examine and understand travel patterns and congestion as they pertain to unique events. With access to the right data, planning authorities can mitigate severe traffic jams and reduce risk of incidents by, for example, closing off these key routes to heavy vehicles during the period of high anticipated trip volumes.
This type of analysis can also be applied to sporting events, concerts, and other periods of high anticipated traffic (such as hurricane and wildfire evacuation events). Leveraging real-time data, as demonstrated in this analysis, is crucial for informed decision-making and effective management of transportation systems during significant events.
Dive into LOCUS Truck's insights surrounding light-duty truck flows in Los Angeles.
Dive into LOCUS Truck's innovative insights into freight flows in Arizona.
In this piece, we delve into the significant shifts in travel behaviors and transportation networks following the 2025 wildfires in California.