Impacts of Warehouses and Ports on Truck Traffic
Dive into LOCUS Truck's innovative insights into freight flows in Arizona.
Los Angeles streets are always buzzing with light-duty trucks that deliver millions of packages and goods to homes and businesses daily. In Los Angeles County, light-duty truck trips constitute an overwhelming majority of truck trips within the region - over 85% of daily trips in 2023!
Light-duty trucks (LDT), which include multi-purpose vehicles and trucks with a gross vehicle weight rating of less than 10,000 lbs., have uniquely different travel characteristics as compared to other truck classes.
With LOCUS’ industry-first product that captures LDT movements, we focus on the “door-to-door” deliveries to glean powerful insights into last-mile logistics, truck movement and stopping patterns, and their impacts on different communities.
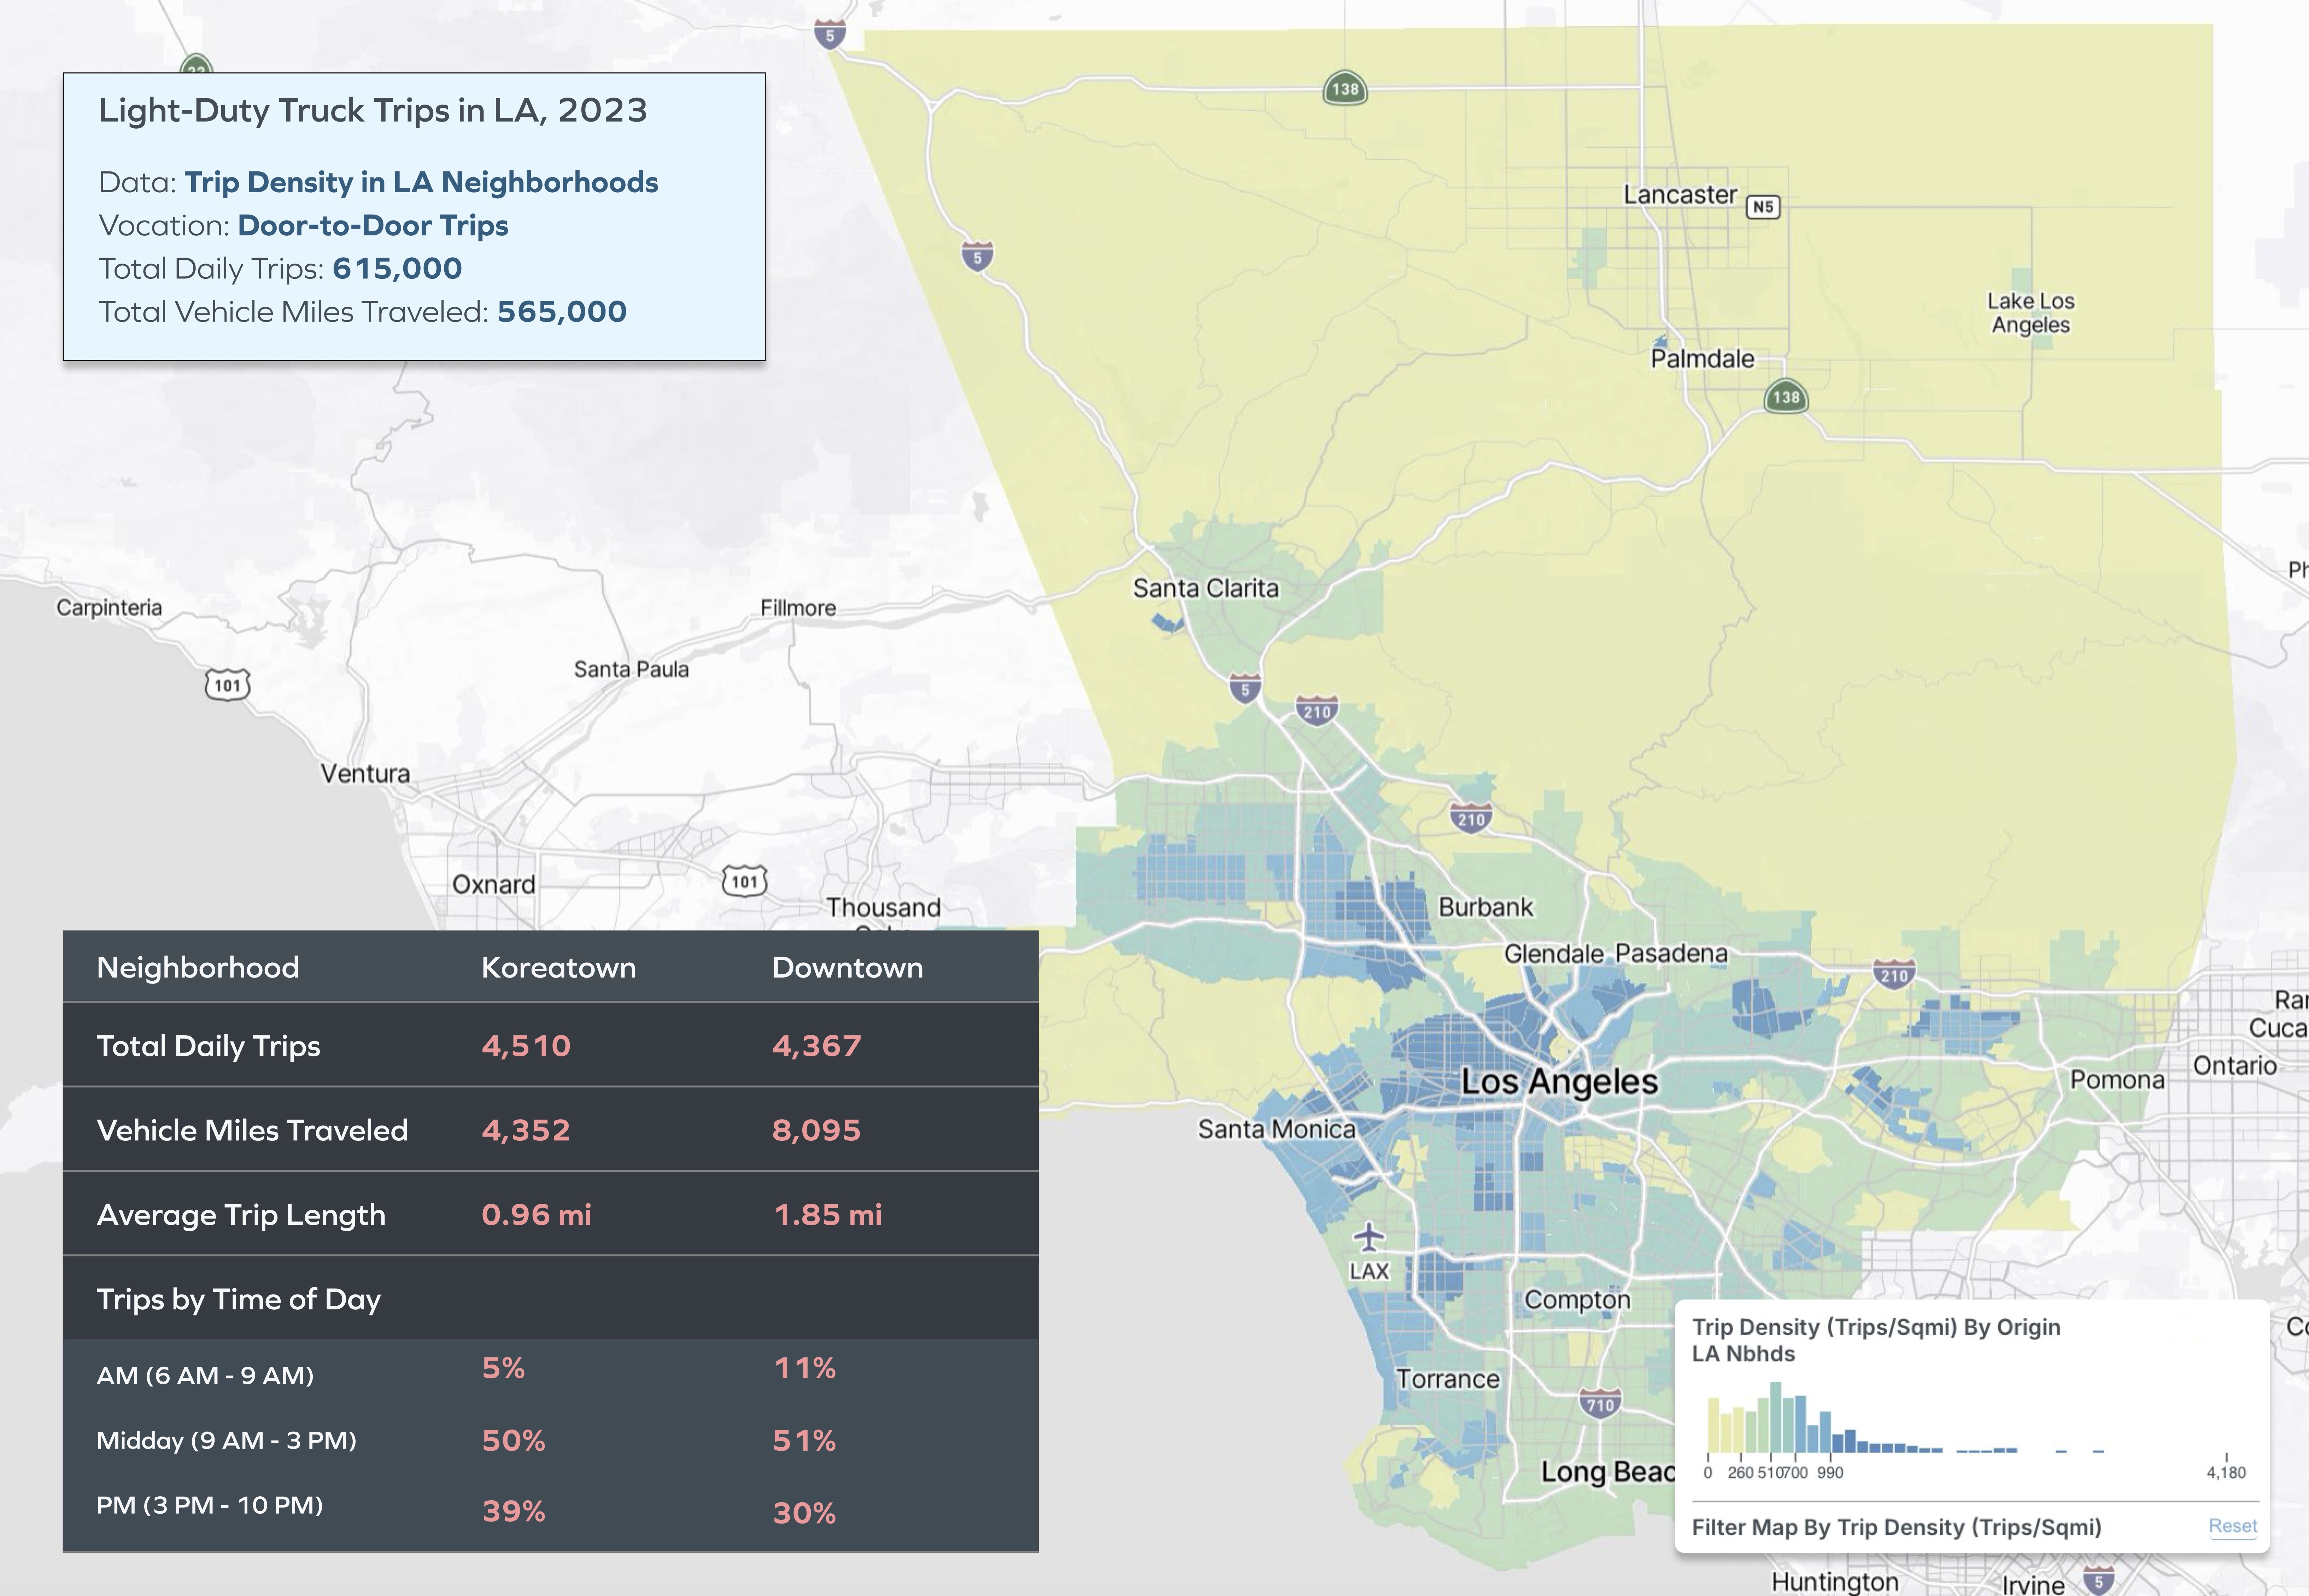
These last-mile deliveries typically tend to be concentrated in the midday period (10AM – 3PM) and PM periods (3PM – 7 PM), accounting for over 70% of the total trips in the county. But as seen in the image above, there are variations by neighborhoods. In DTLA, which has a higher concentration of businesses, the share of trips in the AM peak is almost double of what’s seen in more residential/mixed use neighborhoods such as Koreatown.
Most of these LDT last-mile delivery trips are very short, as trucks make multiple stops. 96% of trips are completed in under 15 mins, with almost all trips under 2 hours.
The short nature of these trips is also reflected in the trip distance distribution – with an average length of just under a mile. Only 4% of the trips are longer than 5 miles, mainly between the distribution centers to stock up on packages – filtering the data to look at trip ends shows exactly that.
In addition to the expanded daily trip data (“planning data”), LOCUS Truck has another powerful feature – operational data layers. Using observed data, we can analyze granular (think monthly, at specific locations) truck stop patterns and fuel mix of trucks visiting a specific location using the observed data.
Here are the statistics in February 2025 for different neighborhoods/cities in LA county – each having a unique land-use mix.
|
Neighborhood |
Total Stops |
Total Vehicles |
Median Stop Duration (Mins) |
% of stops by Electric Vehicles |
|
DTLA |
32,743 |
2,713 |
8.1 |
5% |
|
Hollywood |
39,105 |
2,371 |
7.7 |
2% |
|
Santa Monica |
77,182 |
2,476 |
5.6 |
2% |
|
Pasadena |
112,363 |
2,058 |
3.7 |
3% |
|
Vernon |
13,103 |
619 |
5.9 |
1% |
Access to accurate and validated mobility insights is increasingly critical for business owners, policymakers, and urban planners alike, as they navigate a constantly changing environment. Interested in learning more about LOCUS Truck and how it can support your decision-making? Reach out to us at product@locusdata.io.
Dive into LOCUS Truck's innovative insights into freight flows in Arizona.
Dive into LOCUS Truck's insights surrounding heavy truck flows across different states.
Learn how LOCUS Truck will provide innovative insights into freight flows through advanced analytics and data integration.