Another Way for your Favorite NFL Team to Win
We created an alternate NFL championship playoff based on only transportation metrics.
As one of the nightlife capitals of the world, New York City thrives after dark, particularly on the weekend. However, beneath the lure of late-night revelry lies a significant challenge: the city's transportation systems are not fully equipped to handle these off-peak demands. Modern data tools, including LOCUS, provide insights that can reshape urban transit, allowing it to meet the needs of a vibrant night economy.

Nightlife is a significant economic driver in urban environments, contributing billions of dollars annually to local economies. In New York City, the nightlife industry supports hundreds of thousands of jobs, ranging from entertainment and hospitality to security and transportation services. A report by the New York City Mayor's Office of Media and Entertainment noted that prior to the pandemic, the nightlife sector supported approximately 299,000 jobs, $13.1 billion in employee compensation, and generated $35.1 billion in total economic output.
The Data: Uncovering Stark Contrasts in Travel Patterns
Studying off-peak, late night travel patterns reveals distinct disparities in the movement of people and vehicles between weekdays and weekends. This article examines two nightlife districts that are home to popular venues in Brooklyn. The area studied in Bushwick contains two large event spaces, with smaller venues in nearby areas; these venues are typically open until 4 AM. Boerum Hill contains a series of bars and restaurants that mostly close around 2 AM.
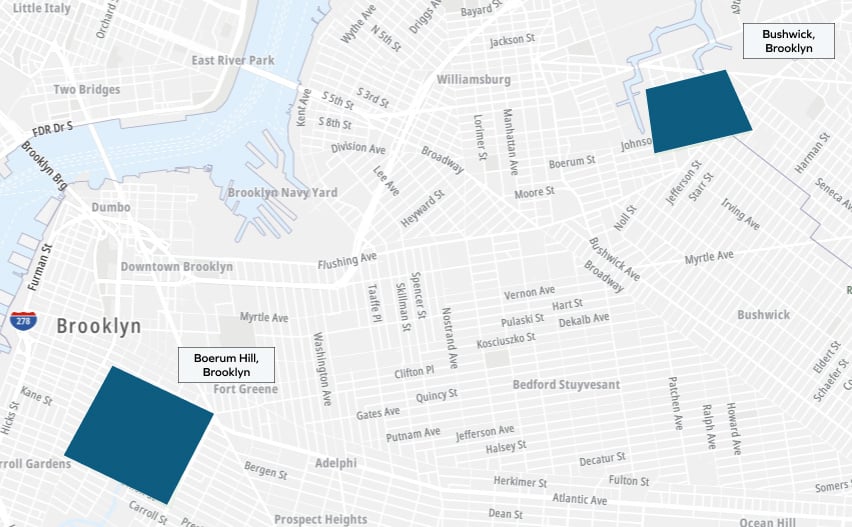
Nightlife districts selected for this analysis
For the purpose of this analysis, a period of 10 weekdays (Monday and Tuesday) and 10 weekends (Saturday and Sunday) have been comparatively analyzed; for similar studies at a higher level, patterns such as these can also be visualized using quarterly data.
Between midnight and 2 am on Randolph Street in Bushwick, weekend trips outnumber weekday trips significantly, with weekend traffic accounting for nearly 86% of the total travel volume. Similarly, on Atlantic Avenue, another bustling artery, the volume of weekend trips is over 3.5 times greater than trips that occur during the weekday during these times.
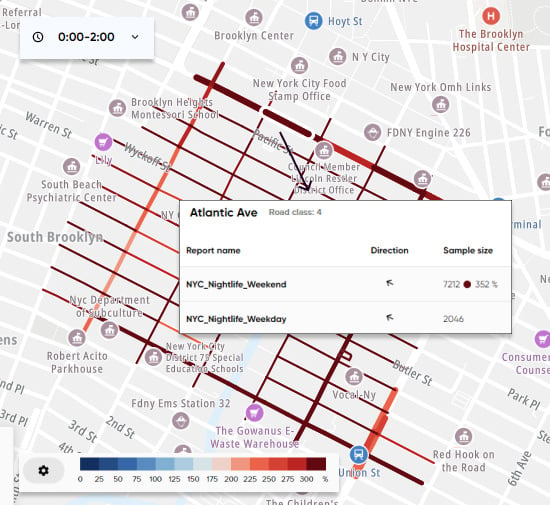
Relative congestion on Atlantic Avenue between midnight and 2 AM
The contrast is even more pronounced when looking at travel from Bushwick to Manhattan, Queens, and other parts of Brooklyn between 2 and 4 AM, when many people return from these venues. These patterns reflect a trend across neighborhoods, revealing a significant spike in late-night movement on weekends. The following image shows these patterns between 2 AM and 4 AM. Darker colors on the map indicate a higher volume of trips originating from the highlighted borough.
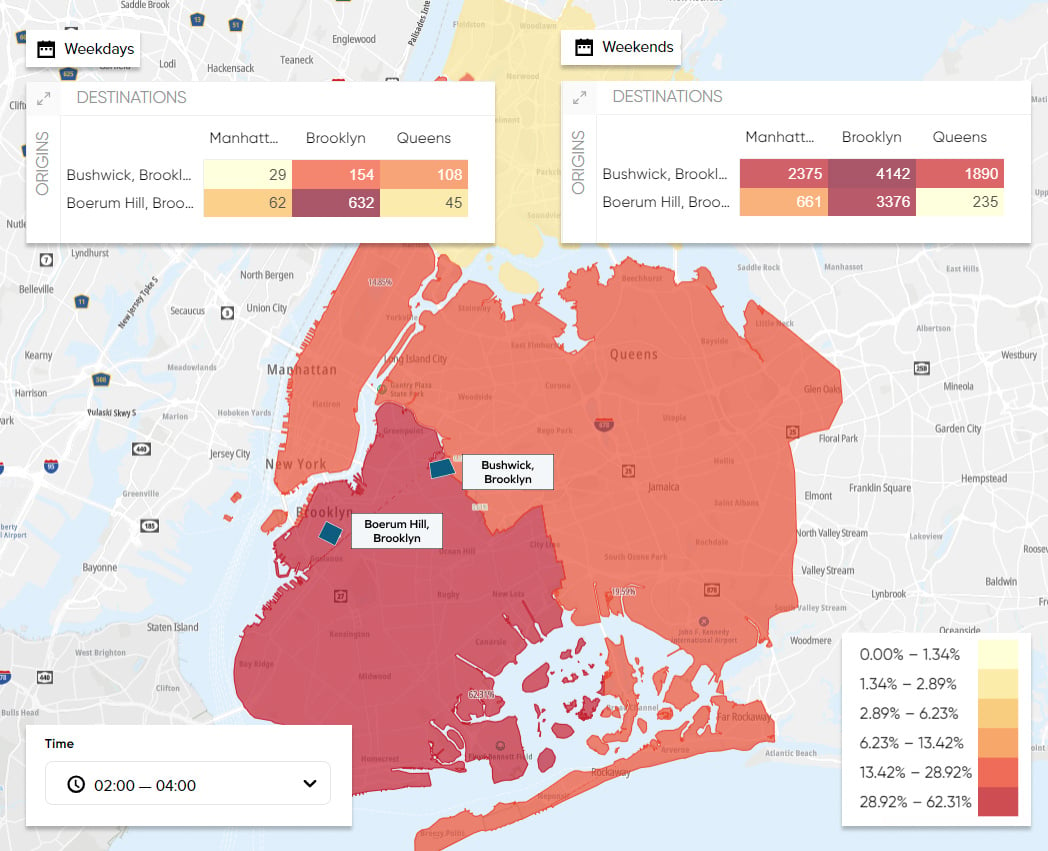
Relative volume of trips between nightlife districts and Manhattan, Brooklyn, and Queens between 2 AM and 4 AM
The transportation flows between areas can also be visualized at a neighborhood level. The areas marked in green show where people are traveling from to access the two nightlife districts. The darker the shade of green, the higher the volume of trips that originate in the highlighted region.
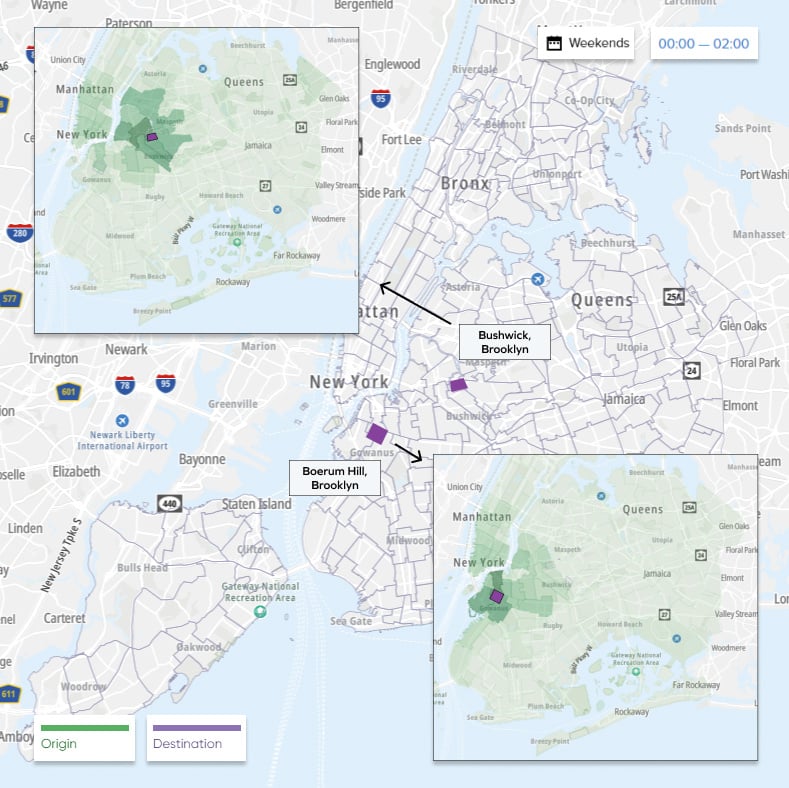
Snapshot of where people travel from to access these respective districts
Efficient public transit is crucial for maximizing the economic benefits of nightlife by ensuring safe travel and reducing driving under the influence (DUI) incidents, thus making venues more accessible and increasing patronage. For instance, London's Night Tube service not only provided a 24-hour service on weekends but also significantly boosted the local economy by £77 million annually and supported around 2,000 jobs. Similarly, the Metropolitan Transportation Authority (MTA) in New York has seen increased ridership from extended night service on select subway lines, demonstrating a strong demand for late-night travel options.
Offering comprehensive public transit options also reduces socioeconomic disparities by providing those without cars the ability to socialize and attend events affordably and safely. This accessibility helps more people experience a “third place” beyond work and home, enhancing community well-being.
One key challenge of late night trips is the increased risk of driving under the influence and subsequent crashes. Impaired driving, which accounted for 32% of all U.S. traffic deaths, killed over 13,500 people in 2022. Young drivers (15-20) are especially vulnerable, with nearly a third of fatal crashes involving drivers with a blood alcohol content (BAC) above the legal limit. To address the critical issue of impaired driving and other traffic safety concerns, the Safe Streets for All (SS4A) program integrates education, enforcement, and engineering to reduce fatalities.
By enforcing stricter BAC limits, supporting alternative transportation, utilizing high-visibility patrols, and incorporating new technologies, the program aims to reduce these risks and ensure safer roads. These initiatives reflect the Safe System approach that recognizes human error and designs infrastructure to mitigate the risks associated with impaired nighttime driving.
As nightlife districts expand, the demand for late-night public transportation services increases. Enhancing these services supports urban growth, reduces reliance on private vehicles, and contributes to sustainable development by easing traffic congestion and lowering emissions. City authorities leveraging big data and SS4A funding can better plan and manage responsive transit networks, ensuring that roads are safe and inclusive for all users, especially during off-peak hours.
We created an alternate NFL championship playoff based on only transportation metrics.
Learn how the new company will be providing innovative transportation solutions through advanced analytics and data integration.
Using LOCUS Transit Insights to study equity community travel patterns and transit needs.